analysis_overview
Welcome to the analysis section. In this overview we present the commands used to run the built in, a description of parameters to customize those pipelines as well as the general structure of data to make your own analysis.
Here is the main command to run an analysis :
(Sequential_Fish) python -m Sequential_Fish analysis <pipeline_name> <path_to_my_working_directory><pipeline_name> can be one or several of the following : 'distributions' ,'density', 'pipeline_metrics', 'colocalization' or 'multivariate' . Alternatively, you can use the 'all' keyword to run all pipelines sequentialy.
Here is a short presentation of analysis pipelines :
- Pipeline metrics : Generate two data boards containing general information on your quantification and its quality.
- Distributions : Automated generation of basic cell metrics in violin plot for quick insight into your quantification.
- Density : Experimental pipeline exploring composition of cluster found in your data.
- Colocalization : Pipeline exploring pairwise co-localization .
- Multivariate : Exploratory multivariate analysis aiming at identifying structure in your data.
While running terminal will only comunicate briefly about modules execution however everything is logged in the analysis_log.log file which is placed in the analysis folder. You can review it if any errors occur so you can track down the problem or communicate it to the github to ask assistance.

Before executing analysis you can modify a set of user parameters by running the settings module and specifying the analysis argument.
(Sequential_Fish) python -m Sequential_Fish settings analysis <path_to_my_working_directory>This command will prompt you with a graphical interface to set up your parameters. Upon validation the settings are stored inside the working directory as JSON file : analysis_settings.json. Keep in mind that settings are not general to your Sequential_Fish installation and you will have to set them up (or copy the json file) in each working directory. This is a measure against mixing-up parameters while running several analysis simultaneously.
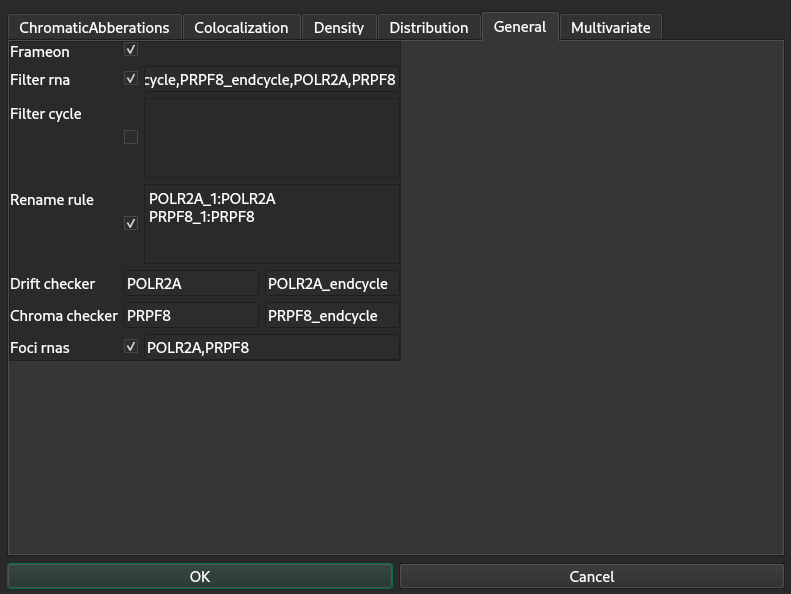
In this section we will cover the general tab of analysis settings other settings will be described in their dedicated pipeline section :
-
Rename rule (dict) : Dictionary allowing to rename rnas, keys are the current name of a detected rna, values are the new name. Each item is separated by linebreak. Note that the renaming occurs before anything else, so if you use a renamed rna in other parameters you have to use the new name.
Example : POL2A_1 is renamed POLR2A is the above screenshot. - Filter rna (list): List of rna to remove from analysis. Rnas must be writen separated with commas : ','.
-
Filter cycle (dict) : Allow the user to remove specific cycles from analysis. Key is the rna distribution to filter and value is a list of integers indicating cycles to remove.
Example : To remove cycles 1,3 and 5 of distribution A and 4,6 of distribution D I should enter :
A:1,3,5
D:4,6 - Drift checker (tuple): Couple of rna names used as controls for drift. See data boards section.
- Chroma checker (tuple) : Couple of rna names used as controls from chromatic abberations. See data boards
- Foci rnas (list) : List of rnas to split into two new distribution between their free population and their clustered population. The original distribution is kept if not added to filter rna.
- Frameon : Some of the plots will be plotted with transparent backgrounds.
#TODO Insert structure illustration
primary key : acquistion_id
This table has an entry for each image stack, that is to say for each field of view, for each cycle. It contains main information on images sucha as localisation, filename or voxel size...
primary key : None
Each entry corresponds to a cycle, table contains rna names and threshold used for detection.
primary key : detection_id
A detection entry is created every time detection routine is ran, that is to say one entry for each field of view, each cycle and each fish color. Contains information on detection paramters and can link Spots table to the rest of the structure.
primary key : spot_id
An entry per spot detected. Contains information on spots localization, intensity and clustering pattern.
primary key : cell_id
An entry per cell quantified. This table contains all metrics from big-fish as well as our own custom metrics package. A full description of available features can be found in distribution pipeline section.
primary key : acquisition_id
An entry per image stack, contains information on the results of drift detection for each location and cycles.
Useful API
If you want to manipulate the spots table to make your own analysis here is a typical workflow you can use to preprocess data and merge safely your tables.import pandas as pd from Sequentil_Fish.analysis.post_processing import Spots_post_processing run_path="" #Define your path to working directory # Load your data Acquisition = pd.read_feather(run_path + "/result_tables/Acquisition.feather") Detection = pd.read_feather(run_path + "/result_tables/Detection.feather") Spots = pd.read_feather(run_path + "/result_tables/Spots.feather") Gene_map = pd.read_feather(run_path + "/result_tables/Gene_map.feather") Cell = pd.read_feather(run_path + "/result_tables/Cell.feather") # Spots_post_processing filter spots outside of segmentation and washout, and merge data to recover cell_ids and distribution names into Spots table. Spots = Spots_post_processing( Spots=Spots, Cell=Cell, Detection=Detection, Acquisition=Acquisition, Gene_map=Gene_map, )If you perform according calibration you can also pass the reference_wavelength argument to perform chromatic abberation correction. See chromatic abberations section. Example : POL2A_1 is renamed POLR2A is the above screenshot.
- Filter rna (list): List of rna to remove from analysis. Rnas must be writen separated with commas : ','.
- Filter cycle (dict) : Allow the user to remove specific cycles from analysis. Key is the rna distribution to filter and value is a list of integers indicating cycles to remove.
Example : To remove cycles 1,3 and 5 of distribution A and 4,6 of distribution D I should enter :
- Drift checker :
- Chroma checker :
- Foci rnas :
- Frameon :