070_020_Bar
Previous Chapter Previous Page Next Page Next Chapter Table of content
var data = {
labels : ["January","February","March","April","May","June","July"],
datasets : [
{
fillColor : "rgba(220,220,220,0.5)",
strokeColor : "rgba(220,220,220,1)",
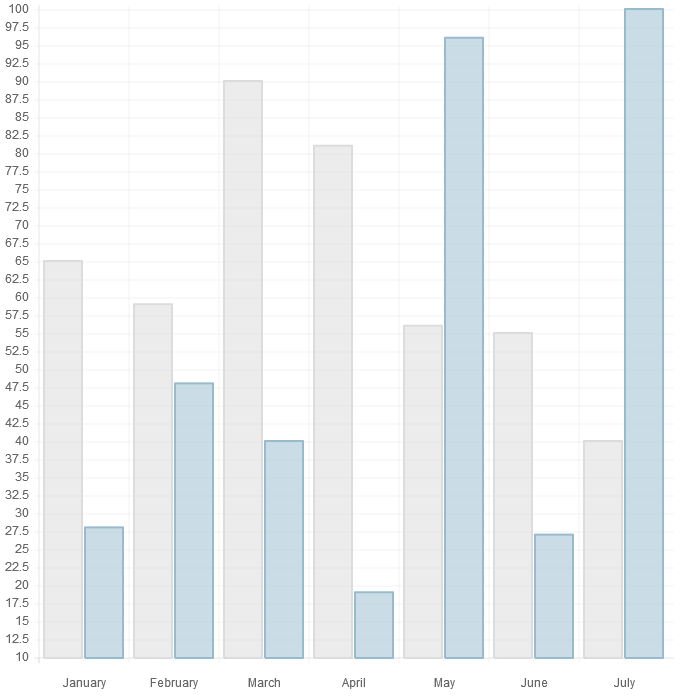
data : [65,59,90,81,56,55,40],
title : "Year 2014"
},
{
fillColor : "rgba(151,187,205,0.5)",
strokeColor : "rgba(151,187,205,1)",
data : [28,48,40,19,96,27,100],
title : "Year 2013"
}
]
}
The bar/StackeBar/HorizontalBar/HorizontalStackeBar chart has a very similar data structure to the line chart with an array of label and datasets. Each dataset specifies a colour and an array of data. Colours are in CSS format.
For each bar group, you may supply a “title” (see the example).
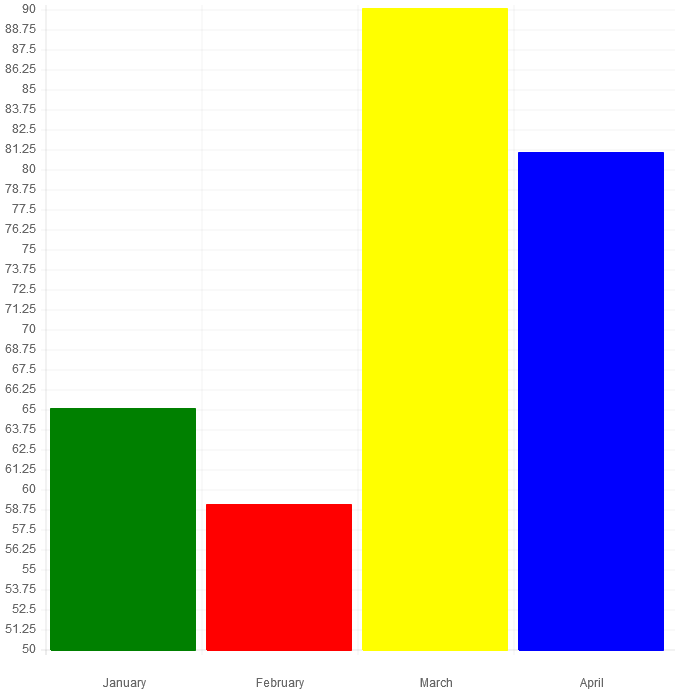
If you want to set a different color for each bar, you just have to specify an array of colors instead of a single color in the fillColor/strokeColor.
Example 1 :
var data = {
labels : ["January","February","March","April"],
datasets : [
    {
        fillColor : ["green","red","yellow","blue"],
        strokeColor : ["green","red","yellow","blue"],
        data : [65,59,90,81],
        title : "Year 2014"
    }
]
}
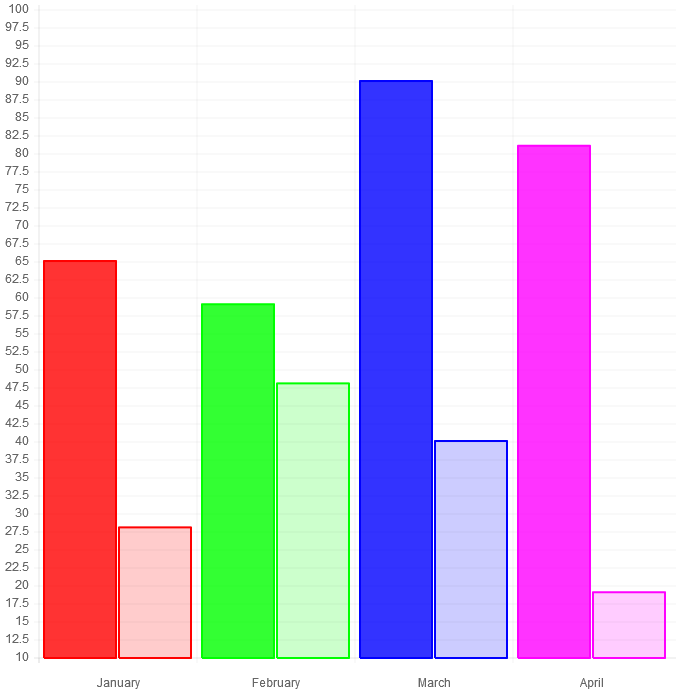
Example2 :
var data = {
labels : ["January","February","March","April"],
datasets : [
    {
        fillColor : ["rgba(255,0,0,0.8)","rgba(0,255,0,0.8)","rgba(0,0,255,0.8)","rgba(255,0,255,0.8)"],
        strokeColor : ["rgba(255,0,0,1)","rgba(0,255,0,1)","rgba(0,0,255,1)","rgba(255,0,255,1)"],
        data : [65,59,90,81],
        title : "Year 2014"
    } ,
    {
        fillColor : ["rgba(255,0,0,0.2)","rgba(0,255,0,0.2)","rgba(0,0,255,0.2)","rgba(255,0,255,0.2)"],
        strokeColor : ["rgba(255,0,0,1)","rgba(0,255,0,1)","rgba(0,0,255,1)","rgba(255,0,255,1)"],
        data : [28,48,40,19,96,27,100],
        title : "Year 2013"
    }
]
}
Instead of assigning a real color (or a array of real colors) to the fillColor and/or strokeColor variable, you can assign a function that returns a color. See chapter “Color Function” later on. See also next chapter.
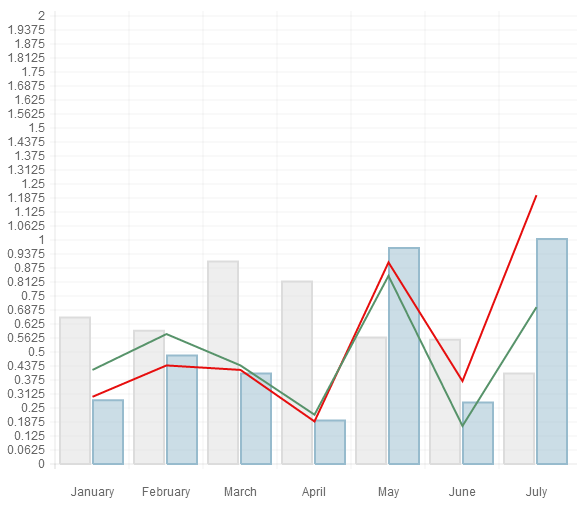
###Array and function values
The value associated to "fillColor", "strokeColor" can be a single value or or an array or a function.
 var data = {
	labels : ["January","February","March","April","May","June","July"],
	datasets : [
		{
			type: "Line",
			fill: false,
			strokeColor : "rgb(230, 14, 14)",
			pointColor : "rgb(205, 151, 155)",
			pointStrokeColor : "#f56691",
			data : [0.30,0.44,0.42,0.19,0.90,0.37,1.20],
      title : "line 1"
		},
		{
			fillColor : "rgba(220,220,220,0.5)",
			strokeColor : "rgba(220,220,220,1)",
			pointColor : "rgba(220,220,220,1)",
			pointStrokeColor : "#fff",
			data : [0.65,0.59,0.90,0.81,0.56,0.55,0.40],
      title : "Bar 1"
		},
		{
			fillColor : "rgba(151,187,205,0.5)",
			strokeColor : "rgba(151,187,205,1)",
			pointColor : "rgba(151,187,205,1)",
			pointStrokeColor : "#fff",
			data : [0.28,0.48,0.40,0.19,0.96,0.27,1.00],
      title : "Bar 2"
		},
		{
			type: "Line",
			fill: false,
			fillColor : "rgba(151, 205, 172, 0.5)",
			strokeColor : "rgb(87, 147, 106)",
			pointColor : "rgb(151, 205, 172)",
			pointStrokeColor : "#fff",
			data : [0.42,0.58,0.44,0.22,0.84,0.17,0.70],
      title : "Line 2"
		},
	]
}
Bar charts can have integrated line charts. To draw a line inside a bar chart you have to use the type option inside the datasets. Additionally you can use the fill option for these lines it's like config.datasetFill so you can colorize the area under the line if the option is true.
Previous Chapter Previous Page Next Page Next Chapter Top of Page