120_Template_variables
Previous Page Next Page Table of content
Depending of the option, the template can use one or more variable in the formula.
Templates are used on 3 places :
- for presenting the Y Axis value (see option scaleLabel)
- for presenting the inGraphData (see option inGraphDataTmpl)
- for presenting the annotates (see option annotateLabel)
For scaleLabel, only one symbolic variable can be used : “value” which present the value on the Y Axis.
Example : see previous chapter.
For inGraphDataTmpl and annotateLabel you can use much more variables. Available variables are computed in function initPassVariableData_part1 and initPassVariableData_part2; It should be easy to add a new variable for inGraphDataTmpl and annotateLabels.
The signification of each variable depends of the chart type where they are used. Let’s go through all those variables for each chart type.
Important: there are lot of variables available through templates; A separate book should be necessary to explain all those variables... In this chapter a short description is given; If you do not understand it, try it in a template and you will probably understand what it contains.
- v1 : title associated to the line/area (= title of the data)
- v2 : label associated to the data
- v3 : data value (= v2 in version 2)
- v4 : cumulated Value (=v3 in version 2)
- v5 : total of all data Value (=v4 in version 2)
- v6 : percentage (=100*v2/v4)
- v7 : X coordinate of the mid-point of thecircle;
- v8 : Y coordinate of the mid-point of the circle;
- v9 : inside radius
- v10 : outside radius of the piece of chart
- v11 : position of the line
- v12 : position of the data in the series
- v13 : Angle amplitude in radiant (=v5 in version 2) (=v15-V14)
- v14 : start angle (in radiant) (=v11 in previous version);
- v15 : stop angle (in radiant) (=v12 in previous version);
Example :
var myoptions = {
  inGraphDataShow : true,
  inGraphDataTmpl : "<%=v1+' '+v2+' '+v3+' '+v4+' '+v5+' '+v6+' '+v7+'\r '+v8+' '+v9+' '+v10+' '+v11+' '+v12+' '+v13+' '+v14+' '+v15%>"
}

    var mydata2 = {
         labels : ["2015","2016"],
         datasets : [
       {
          data : [30,15],
          fillColor : "rgba(255,255,0,0.5)",
          title : "January"
       },
       {
          data : [90,],
          fillColor : "rgba(200,0,255,0.5)",
          title : "February"
       },
       {
          data : [24,10],
          fillColor : "rgba(0,255,200,0.5)",
          title : "March"
       }
    ]
   };
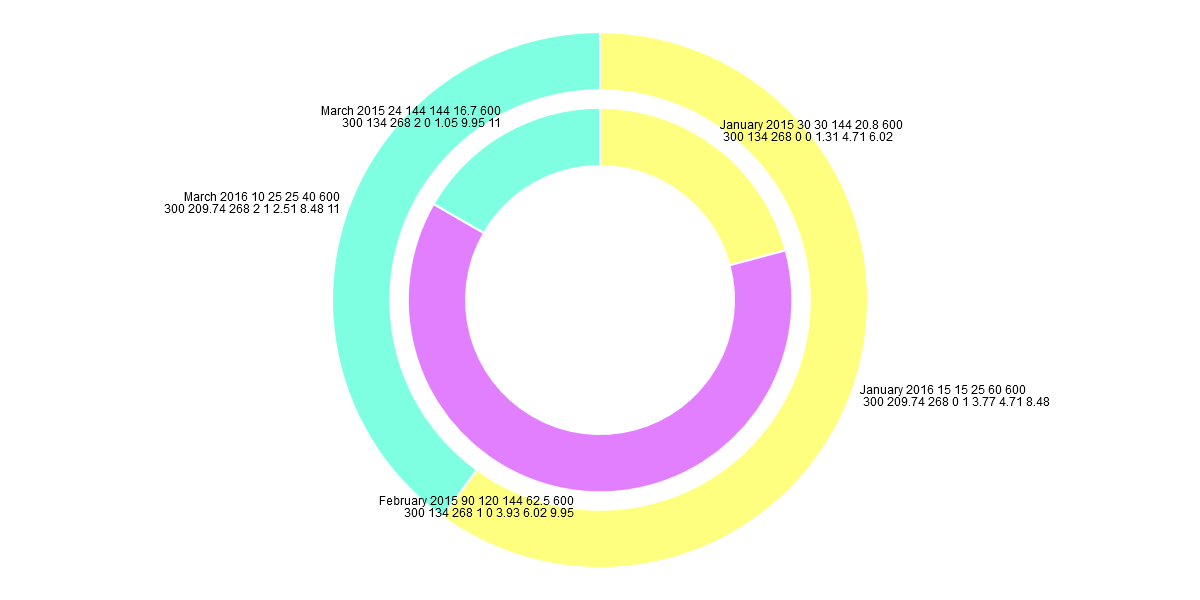
Associated to February 2015, the "in data (chart) data" displays following information when option inGraphDataTmpl has value "<%=v1+' '+v2+' '+v3+' '+v4+' '+v5+' '+v6+' '+v7+'\r '+v8+' '+v9+' '+v10+' '+v11+' '+v12+' '+v13+' '+v14+' '+v15%>" : “February 2015 90 120 144 62.5 600 300 134 268 1 0 3.93 6.02 9.95"
- v1 = February
- v2 = 2015
- v3 = 90 (= value associated to February 2016)
- v4 = 120 (= total of all value up to February = January (30) + February (90) )
- v5 = 144 (= grand total 2015 = January (30) + February (90) + March (24) )
- v6 = 62.5 (= percent of the chart for February 2016 = 100*v3/v5)
- (v7,v8) = (600,300) = (X,Y) coordinate of the center of the Pie
- v9 = 134 (=radius of the inside part)
- v10 = 268 (=radius of the outside part of the Doughnut)
- v11 = 1 (= February is the second data in the datasets tabel ; The first data (January has 0 for v11 value)).
- v12 = 0 (= 2016 is the first data in the series).
- v13 = 3.93 (= angle amplitude in radiant for the “February 2016 ” piece of chart) = V15-v14
- v14 = 6.02 (=start angle in radiant of February 2016)
- v15 = 9.95 (=stop angle in radiant of February 2016)
New variables available since ChartNew.js V2 (December 2014)
- lgtxt: idem v1 but not formatted
- lgtxt2: idem v2 but not formatted
- datavalue: idem v3 but not formatted
- cumvalue: : idem v4 but not formatted
- totvalue: : idem v5 but not formatted
- pctvalue: idem v6 but not formatted
- midPosX : idem v7 but not formatted
- midPosY : idem v8 but not formatted
- startRadius : idem v9 but not formatted
- stopRadius : idem v10 but not formatted
- i: idem v11 but not formatted
- j: idem v12 but not formatted
- segmentAngle: : idem v13 but not formatted
- startAngle: idem v14 but not formatted
- endAngle: idem v15 but not formatted
- realStartAngle : real cumulative angle
- maxvalue : maximum value in the data
- minvalue : minimum value in the data
- lmaxvalue : maximum value in the datasets for the data
- lminvalue : minimum value in the datasets for the data
- grandtotal : total of all datas
- firstNotMissing : first not missing value position in the data
- lastNotMissing : last not missing value position in the data
- prevNotMissing : position in the data of previous not missing value
- prevMissing : position in the data of previous missing value
- nextNotMissing : position in the data of next not missing value;
- firstAngle : starting Angle
- data: all the data
- v6T: = datavalue/ grandtotal
- v1 : title associated to the line/area (= title of the data)
- v2 : label associated to the data
- v3 : data value
- v4 : difference between the data of previous line and the data (v3)
- v5 : difference between the data (v3) and the data on next line
- v6 : max value for the data
- v7 : total of the values of the data
- v8 : percentage ( = 100*v3/v7)
- (v9,v10) : (X,Y) coordinate of the point
- v11 : position of the line
- v12: position of the data in the series
Example :
var dataline = {
labels : ["Eating","Drinking","Sleeping","Designing"],
datasets : [
	{
		fillColor : "rgba(220,0,0,0.5)",
		strokeColor : "rgba(220,0,0,0.5)",
		pointColor : "rgba(220,0,0,0.5)",
		pointStrokeColor : "rgba(220,0,0,0.5)",
		data : [90,81,98,98] ,
		title : "Year 2014"
	},
	{
		fillColor : "rgba(0,220,0,0.5)",
		strokeColor : "rgba(0,220,0,0.5)",
		pointColor : "rgba(0,220,0,0.5)",
		pointStrokeColor : "rgba(0,220,0,0.5)",
		data : [65,59,90,81] ,
	title : "Year 2013"
	},
	{
		fillColor : "rgba(0,0,220,0.5)",
		strokeColor : "rgba(0,0,220,0.5)",
		pointColor : "rgba(0,0,220,0.5)",
		pointStrokeColor : "rgba(0,0,220,0.5)",
		data : [30,35,60,20] ,
		title : "Year 2012"
	}
]
}
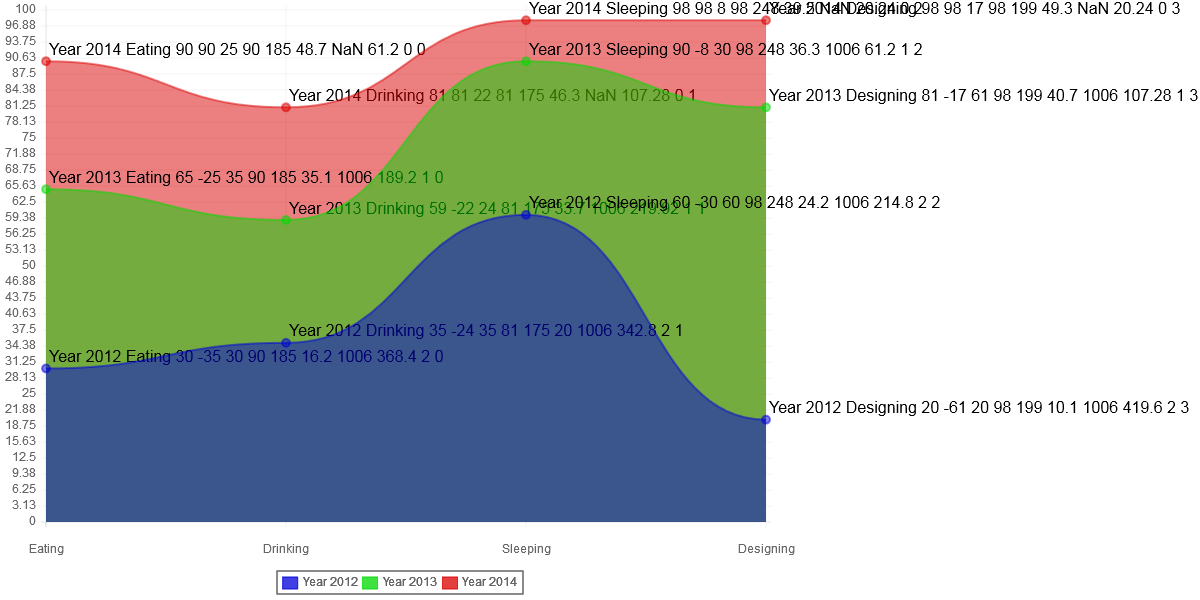
Associated to Sleeping for year 2013, the "in data (chart) data" displays following information when option inGraphDataTmpl has value "<%=v1+' '+v2+' '+v3+' '+v4+' '+v5+' '+v6+' '+v7+' '+v8+' '+v9+' '+v10+' '+v11+' '+v12%>" : “year 2013 Sleeping 90 -8 30 98 248 36.3 1006 61.2 1 2”
- v1 = Year 2013 (= title of the data)
- v2 = Sleeping (=label of the data)
- v3= 90 (= value associated to “sleeping” in the data)
- v4 = -8 (= difference between the data of previous line (98) and the data (90))
- v5 = 30 (= difference between the data (90) and the data on next line (60))
- v6 = 98 (= max value for “sleeping”)
- v7 = 248 (= total for “sleeping” = 98+90+60)
- v8 = 36.3 (=percentage = 100*v3/v7)
- v8T = 36.3 (=percentage of all the data = 100*v3/grandtotal)
- (v9,v10) = (1006,61.2) = (X,Y) coordinate of the point
- v11 = 1 (=” year 2013” is the second line of data ; The first line (year 2012) has 0 for v11 value).
- v12= 2 (=”sleeping” is the third data in the series)
- lgtxt: idem v1 but not formatted
- lgtxt2: idem v2 but not formatted
- datavalue: idem v3 but not formatted
- diffprev : idem v4 but not formatted
- diffnext : idem v5 but not formatted
- maxvalue : idem v6 but not formatted
- totvalue : idem v7 but not formatted
- pctvalue: idem v8 but not formatted
- pctvalueT: idem v8T but not formatted
- posX : idem v9 but not formatted
- xPos : idem v9 but not formatted
- posY : idem v10 but not formatted
- i: idem v11 but not formatted
- j: idem v12 but not formatted
- grandtotal : sum of all the data
- cumvalue: total on axis
- minvalue : minimum on axis
- lmaxvalue : max value on line
- lminvalue : min value on line
- firstNotMissing : first not missing value in line
- lastNotMissing : last not missing value in line
- prevNotMissing : previous not missing value in axis
- prevMissing : previous missing value in axis
- nextNotMissing : next not missing value in axis
- data: all the data
- annotateStartPosX & annotateStartPosY : start position of the annotate axis (used when option detectAnnotateOnFullLine = true).
- annotateEndPosX & annotateEndPosY : end postition of the annotate axis (used when option detectAnnotateOnFullLine=true).
- D1A & D1B : D1A*x+D1B = equation of the line passing on annotateStart/End
- graphMin : bottom value of Y axis
- graphMax : top value of Y axis
- xAxisPosY : position of the zero value on Y axis
- yAxisPosX : position of the left axis
- yAxisPos : position of the bottom axis
- zeroY : difference between xAxisPosY and yAxisPos
- valueHop : space in pixels beween two labels on Y axis
- nbValueHop : number of values on X axis (the first one is not counted)
- scaleHop : space (in pixels) between two labels on Y axis
- calculatedScale : pointer to the calculatedScale variable
- logarithmic : true if the associated axis is in logarithm
- lmaxvalue_offset : difference between the posY of the maxiumum value on the line and yAxisPosX
- lminvalue_offset : difference between the posY of the minimum value on the line and yAxisPosX
- yPosOffset : difference between posY and yAxisPosX
- midPosX & midPosY : coordinate of the center
- int_radius : internal Radius
- ext_radius : external Radius
- radiusOffset : idem ext_radius
- calculated_offset: distance between the point and the center
- offsetX, offsetY : offset from the center to the point
- vbubble : bubble value
- v1 : title associated to the bar (= title of the data)
- v2 : label associated to the data
- v3 : data value
- v4 : cumulated value for the group of bar
- v5 : total value for the group of bar
- v6 : percentage (=100*v3/v5)
- v6T : percentage of all the data (=100*v3/grandtotal)
- (v7,v8) : (X,Y) coordinate of the bottom left corner of the bar
- (v9,v10) : (X,Y) coordinate of the top right corner of the bar
- v11 : position of the line
- v12: position of the data in the series
Example :
var databar = {
labels : ["January","February","March"],
datasets : [
	{
		fillColor : ["rgba(255,0,0,0.8)","rgba(0,255,0,0.8)","rgba(0,0,255,0.8)","rgba(255,0,255,0.8)"],
		strokeColor : ["rgba(255,0,0,1)","rgba(0,255,0,1)","rgba(0,0,255,1)","rgba(255,0,255,1)"],
		pointColor : "rgba(220,220,220,1)",
		pointStrokeColor : "#fff",
		data : [65,37,80],
		title : "Year 2014"
	} ,
	{
		fillColor : ["rgba(255,0,0,0.2)","rgba(0,255,0,0.2)","rgba(0,0,255,0.2)","rgba(255,0,255,0.2)"],
		strokeColor : ["rgba(255,0,0,1)","rgba(0,255,0,1)","rgba(0,0,255,1)","rgba(255,0,255,1)"],
		pointColor : "rgba(151,187,205,1)",
		pointStrokeColor : "#fff",
		data : [60,50,40],
		title : "Year 2013"
	},
	{
		fillColor : ["rgba(255,0,0,0.2)","rgba(0,255,0,0.2)","rgba(0,0,255,0.2)","rgba(255,0,255,0.2)"],
		strokeColor : ["rgba(255,0,0,1)","rgba(0,255,0,1)","rgba(0,0,255,1)","rgba(255,0,255,1)"],
		pointColor : "rgba(151,187,205,1)",
		pointStrokeColor : "#fff",
		data : [90,27,61],
		title : "Year 2012"
	}
]
}
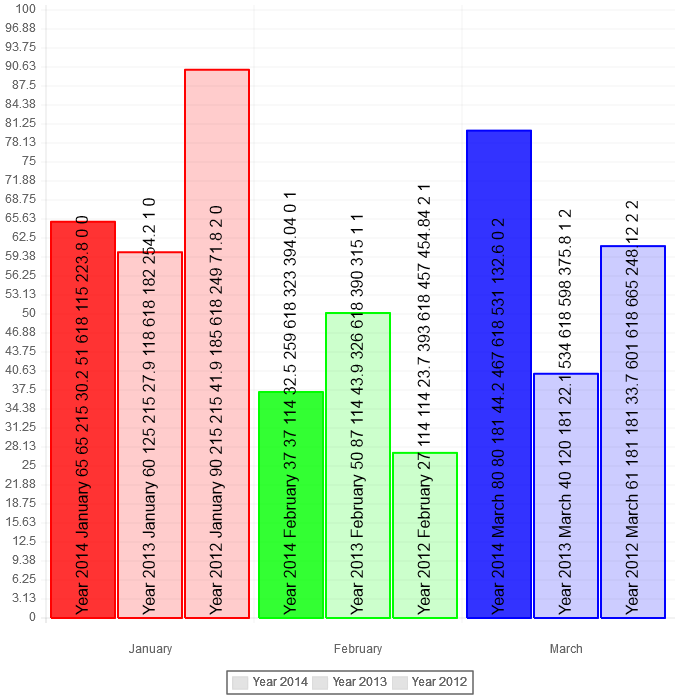
Associated toFebruary for year 2013, the "in graph (chart) data" displays following information when option inGraphDataTmpl has value "<%=v1+' '+v2+' '+v3+' '+v4+' '+v5+' '+v6+' '+v7+' '+v8+' '+v9+' '+v10+' '+v11+' '+v12%>" :
“year 2013 February 50 87 114 43.9 326 618 390 315 1 1”
- v1 = Year 2013 (= title of the data)
- v2 = February (=label of the data)
- v3= 50 (= value associated to “February” in the data)
- v4 = 87 (= cumulated value = 50 (year 2014) + 37 (year 2013)
- v5 = 114 (= total value = 50 (year 2014) + 37 (year 2013) + 27 (year 2012))
- v6 = 43.9 (= percentage = 100*v3/v5)
- (v7,v8) = (326,618) = coordinate of top left corner of the rectangle
- (v9,v10) = (390,315) = coordinate of bottom right corner of the rectangle
- v11 = 1 (=” year 2013” is the second group of data ; The first group (year 2014) has 0 for v11 value).
- v12= 1 (=”February” is the second data in the series)
- lgtxt: idem v1 but not formatted
- lgtxt2: idem v2 but not formatted
- datavalue: idem v3 but not formatted
- cumvalue : idem v4 but not formatted
- maxvalue : idem v5 but not formatted
- pctvalue: idem v6 but not formatted
- pctvalueT: idem v6T but not formatted
- xPosLeft : idem v7 but not formatted
- yPosBottom : idem v8 but not formatted
- xPosRight : idem v9 but not formatted
- yPosTop : idem v10 but not formatted
- i: idem v11 but not formatted
- j: idem v12 but not formatted
- graphMin : bottom value of Y axis
- graphMax : top value of Y axis
- grandtotal : sum of all the data
- minvalue : minimum on axis
- lmaxvalue : max value on line
- lminvalue : min value on line
- firstNotMissing : first not missing value in line
- lastNotMissing : last not missing value in line
- prevNotMissing : previous not missing value in axis
- prevMissing : previous missing value in axis
- nextNotMissing : next not missing value in axis
- data: all the data