100_040_CrossText
Previous Chapter Previous Page Next Page Next Chapter Table of content
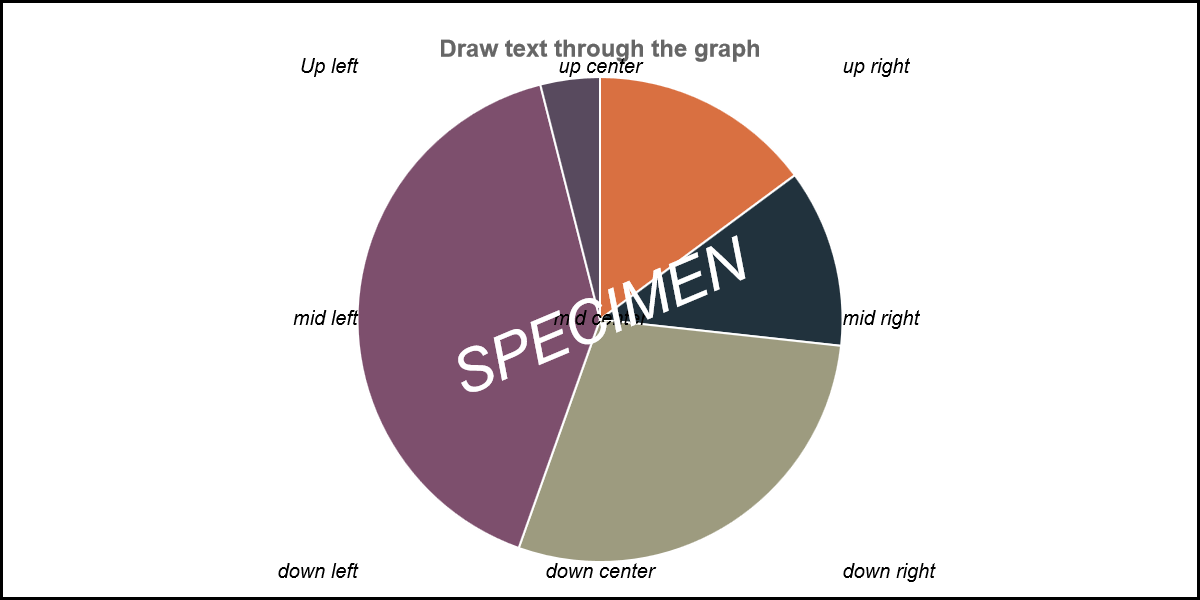
On several part of the chart, you can put text : title, sub-title, footnote, axis labels, etc… CrossText is another possibility to add text on your chart. With CrossText, you can put text where ever you want! For instance, if you want to write the text “SPECIMEN” or “TEST” through your chart, it is possible with the crossText options.
With crossText options, you put more than one text on the chart : the values for all options related to crossText are arrays of values. The most important option is “crossText” (the first option explained here after). If the crossText option is an array with “n” values, only the “n”-first values in the array of the other associated options will be taken in account. If the value of one of the other associated options has less than “n” values, the last defined value will be taken in account for the “missing” values.
Example :
 crossText=[“V1”,”V2”,”V3”];
 crossTextAngle=[0];
 crossTextFontSize=[10,12];
 crossTextPosX=[10,20,30,40];
This will be similar as :
 crossText=[“V1”,”V2”,”V3”];
 crossTextAngle=[0,0,0];
 crossTextFontSize=[10,12,12];
 crossTextPosX=[10,20,30];
Tips : When you use the crossText options, it can be usefull to use the spaceTop, spaceLeft, spaceRight and spaceLeft options.
crossText is really a powerfull set of options…. but really difficult to explain. This part of the documentation has to be re-worked by someone that understand it and that is able to explain it in simple words…
- crossText
- crossTextAlign
- crossTextAngle
- crossTextBaseline
- crossTextFontColor
- crossTextFontFamily
- crossTextFontSize
- crossTextFontStyle
- crossTextFunction
- crossTextIter
- crossTextOverlay
- crossTextPosX
- crossTextPosY
- crossTextRelativePosX
- crossTextRelativePosY
##crossText
Description : in the crossText option, specify – in the form of an array - the texts that has to be printed in your chart. In some case, it could be that you want to specify a text that is changing during the animation. Example : in the middle of an animated doughnut chart, you want to display a value that increases with the animation. The last value to display (when the animation is terminated) is the first value of the doughnut element. If you want to do this, specify “%” as text value and specify a function in crossTextFunction option. See crossTextFunction for more explanations.
Chart types : All
Values : an array of text values.
Default value : [“”]
Sample : crossText : [“first Text”,”second Text”,”Third Text”]
See also : title, subtitle, footNote, xAxisLabel, yAxisLabel
##crossTextAlign
Description : Through other options – see crossTextRelativePosX, crossTextRelativePosY, crossTextPosX and crossTextPosY -, you can specify a position of the text on the chart. Associated to this position, through option crossTextAlign, you can specify the horizontal alignment of the text. If the assigned value is “default”, the position will depend on the parameter crossTextRelativePosX.
Chart types : All
Values : “left”, “center”, “right” or “default”
Default value : [“center”]
Sample : crossTextAlign : [“center”,”center”,”left”,”right”,”center”]
See also : crossTextBaseline
##crossTextAngle
Description : Through other options – see crossTextRelativePosX, crossTextRelativePosY, crossTextPosX and crossTextPosY -, you can specify a position of the text on the chart. Specify the rotation angle to apply for the text through the crossTextAngle option.
Chart types : All
Values : 0->360
Default value : [0]
Sample : crossTextAngle : [90,180,270,0]
See also :
##crossTextBaseline
Description : Through other options – see crossTextRelativePosX, crossTextRelativePosY, crossTextPosX and crossTextPosY -, you can specify a position for the text on the chart. Associated to this position, through option crossTextBaseline, you can specify the vertical alignment of the text. If the assigned value is “default”, the position will depend on the parameter crossTextRelativePosY.
Chart types : All
Values : “bottom”, “middle”, “top” or “default”
Default value : [“middle”]
Sample : crossTextBaseline : [“middle”,”middle”,”top”,”bottom”,”bottom”]
See also : crossTextAlign
##crossTextFontColor
Description : specify the font color with the option crossTextFontColor
Chart types : All
Values : an array of colors
Default value : ["rgba(220,220,220,1)"]
Sample : crossTextFontColor : [“white”,”black”];
See also :
##crossTextFontFamily
Description : specify the font of the texts with option crossTextFontFamily.
Chart types : All
Values : an array of available font.
Default value : ["'Arial'"]
Sample : crossTextFontFamily : [“’Arial’”]
See also :
##crossTextFontSize
Description : Specify the font size with option crossTextFontSize
Chart types : All
Values : an array of positive integer.
Default value : [12]
Sample : crossTextFontSize : [10,8,20]
See also :
##crossTextFontStyle
Description : specify the font style of the texts with option crossTextFontStyle.
Chart types : All
Values :
Default value : [“normal”]
Sample : crossTestFontStyle : [“normal”,”italic”]
See also :
##crossTextFunction
Description : crossText can be a variable text defined through a function. For instanstance, you can display the date, the time or even the data them self. In following sample, the date is printed on the top left corner, the time on the bottom right corner and the percentage of the data of the first slice is displayed in the middle of the doughnut.
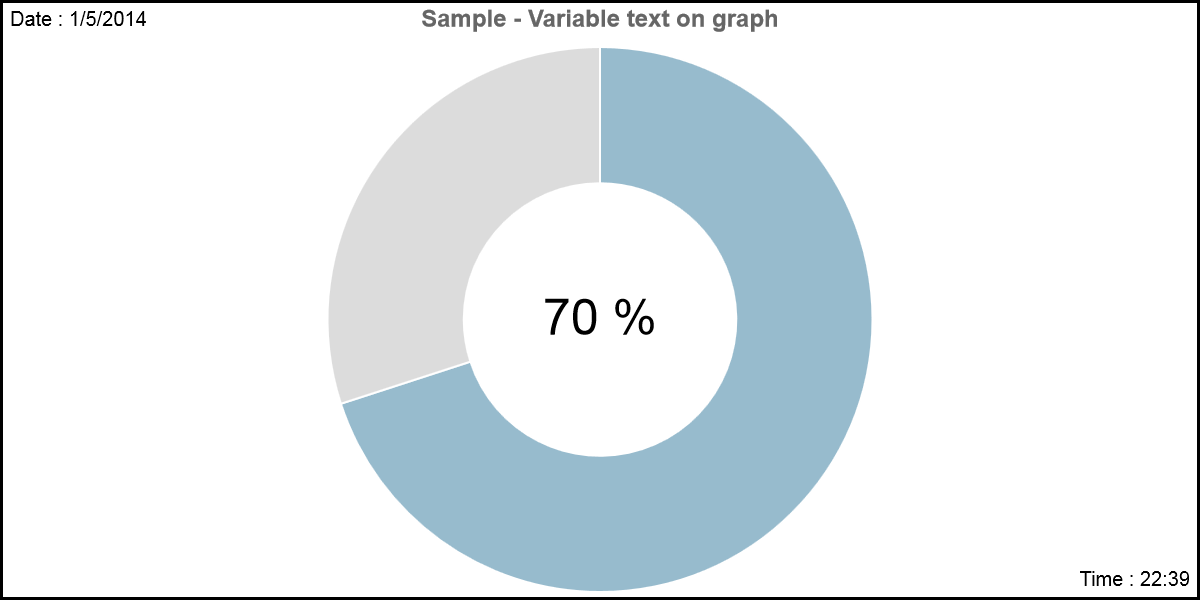
How to achieve such a result ?
For each variable text, set a value of “%” in the crossText option. In our sample, there are 3 variable texts : crossText : [“%”,”%”,”%”] If one of the texts is a variable text, you have to specify a function that will be called several times during the animation. This function has to return the text that has to be displayed. In the option crossTextFunction, you have to specify the name of the called function and, in your personal web page, you have to write the code of this function. When is the function called ? In important point that you have to know is “when is the function called”. If the option “animation” is set to true, the chart appears progressively. The display is cut in steps. At each step, the display evolves to the final result. Between each step, the chart zone of the canvas is completely erased. If the option “animation” is set to false, consider that there is only one step. For each variable crossText (“%” as first character), the function can be called :
- at each iteration or on a specific iteration (see option crossTextIter)
- either before the chart is displayed or after (see option crossTextOverlay).
Parameters of the function At each call, the function receives serveral parameters :
function myFunction(numtxt,valtxt,ctx,config,posX,posY,borderX,borderY,overlay,data,animPC)
- numtxt : number of the variable crossText;
- valtxt : value of the variable crossText option associated;
- ctx : context that is calling the function;
- config : options of the chart;
- overlay : true if the function is called before the chart is drawn; false otherwise (value in option config.crossTextOverlay[numtxt];)
- posX,posY : coordinates of the center of the chart;
- borderX: x-width (in pixels) between the chart zone and the left border;
- borderY : y-heigth (in pixels) between the chart zone and the top border;
- data : data associated to the chart;
- animPC : animPC is a value between 0 and 1; During the animation, animPC increase and will get the value 1 at the last iteration of the animation.
The function has to return a text value corresponding to what has to be displayed for this variable (numtxt) at this iteration.
It is really difficult to explain, but it is really powerfull… Try and analyse the following code ; I think that it is a good sample to understand how it works :
 <html>
 <meta http-equiv="Content-Type" content="text/html;charset=utf-8" />
 <head>
     <title>Demo ChartNew.js</title>
 </head>
 <body>
 <!--[if lte IE 8]><SCRIPT src='source/excanvas.js'></script><![endif]--><SCRIPT src='source/ChartNew.js'></script>
 <center>
 <FONT SIZE=6><B>Demo of ChartNew.js !</B></FONT>    <BR>
 <script>
 defCanvasWidth=1200;
 defCanvasHeight=600;
 var mydata4 = [
 {
     value : 70,
     color: "rgba(151,187,205,1)",
     title : "data1"
 },
 {
      value : 30,
      color: "rgba(220,220,220,1)",
      title : "data1"
 }
 ]
 function myCrossTextFunction(numtxt,valtxt,ctx,config,posX,posY,borderX,borderY,overlay,data,animPC){
    var now         = new Date();
    var hour        = now.getHours();
    var minute      = now.getMinutes();
    var second      = now.getSeconds();
    var monthnumber = (now.getMonth()+1);
    var monthday    = now.getDate();
    var year        = (now.getFullYear());
    if(numtxt==0)return("Date : "+monthday+"/"+monthnumber+"/"+year);
    else if(numtxt==1)return("Time : "+hour+":"+minute);
    else if(numtxt==2) return(Math.round(animPC*data[0].value)+ " %");
 }
 var varcrosstxt = {
    crossText : ["%disp time","%dispdate","%dispdata"],
    crossTextIter: ["first","last","all"],
    crossTextOverlay :   [true],
    crossTextFontSize : [20,20,50],
    crossTextFontColor : ["black"],
    crossTextRelativePosX : [0,4,2],
    crossTextRelativePosY : [0,4,2],
    crossTextPosX : [10,-10,0],
    crossTextPosY : [10,-10,0],
    crossTextAlign : ["left","right","center"],
    crossTextBaseline : ["top","bottom","middle"],
    crossTextFunction : myCrossTextFunction,
    canvasBorders : true,
    graphTitle : "Sample - Variable text on graph"
 }
 document.write("<canvas id=\"canvas_doughnut3\" height=\""+defCanvasHeight+"\" width=\""+defCanvasWidth+"\"></canvas>");
 window.onload = function() {
     var myLine = new Chart(document.getElementById("canvas_doughnut3").getContext("2d")).Doughnut(mydata4,varcrosstxt);
 }
 </script>
 </body>
 </html>
Chart types : All
Values : the name of a function written by you.
Default value : null
Sample : crossTextFunction : myCrossTextFunction,
See also : crossText, crossTextIter, crossTextOverlay.
##crossTextIter
Description : Each crossText can be displayed at each iteration or at a specific iteration of the animation. If you specify “all”, the text will be displayed at each iteration; if you specify “first”, the text will be displayed at first iteration; If you specify “last”, the text will be displayed at last iteration; If you specify a number, the text will be displayed at this iteration of the animation.
Chart types : All
Values : “all”, “first”, “last” or an integer.
Default value : [“all”]
Sample : crossTextIter : [“first”,”last”,”all”,4, 1]
See also : crossText
##crossTextOverlay
Description : the text can be written over the chart or under the chart. Specify true if the text is displayed over the chart; false otherwise.
Chart types : All
Values :true or false
Default value : [true]
Sample : crossTextOverlay : [true,true,true, false]
See also :
##crossTextPosX
Description : whith the options crossTextRelativePosX, crossTextRelativePosY you can specify a relative position for the text; The crossTextPosX specifies the horizontal padding position of the text in pixels.
Chart types : All
Values :
Default value : [0]
Sample :
See also : crossTextPosY, crossTextRelativePosX, crossTextRelativePosY
##crossTextPosY
Description : whith the options crossTextRelativePosX, crossTextRelativePosY you can specify a relative position for the text; The crossTextPoY specifies the vertical padding position of the text in pixels.
Chart types : All
Values :
Default value : [0]
Sample :
See also : crossTextPosX, crossTextRelativePosX, crossTextRelativePosY
##crossTextRelativePosX
Description : with option crossTextRelativePosX, you specifiy the horizontal position of the text in the canvas :
- 0 : on the left of the canvas;
- 1 : on the left of the chart (-> potistion of the Y left Axis)
- 2 : on the center of the chart
- -2 : on the center of the canvas
- 3 : on the right of the chart (-> position of the Y right Axis)
- 4 : on the right of the canvas
Chart types : All
Values : 0,1,2, -2, 3, 4
Default value : [2]
Sample 1 :
 crossText : ["Up left","up center","up right","mid left","mid center","mid right","down left","down center","down right"],
 crossTextRelativePosX : [1,2,3,1,2,3,1,2,3],
 crossTextRelativePosY : [1,1,1,2,2,2,3,3,3],
Sample 2 :
 crossText : ["Up left","up center","up right","mid left","mid center","mid right","down left","down center","down right"],
 crossTextRelativePosX : [0,-2,4,0,-2,4,0,-2,4],
 crossTextRelativePosY : [0,0,0,-2,-2,-2,4,4,4],
See also : crossTextPosX,crossTextPosY, crossTextRelativePosX, crossTextRelativePosY
##crossTextRelativePosY
Description : with option crossTextRelativePosY, you specifiy the vertical position of the text in the canvas :
- 0 : at the top of the canvas;
- 1 : at the top of the chart (-> position of the X top Axis)
- 2 : on the center of the chart
- -2 : on the center of the canvas
- 3 : at the bottom of the chart (-> position of the X bottom Axis)
- 4 : at the bottom of the canvas
Chart types : All
Values : 0, 1, 2, -2, 3, 4
Default value : [2]
Sample 1:
 crossText : ["Up left","up center","up right","mid left","mid center","mid right","down left","down center","down right"],
 crossTextRelativePosX : [1,2,3,1,2,3,1,2,3],
 crossTextRelativePosY : [1,1,1,2,2,2,3,3,3],
Sample 2 :
 crossText : ["Up left","up center","up right","mid left","mid center","mid right","down left","down center","down right"],
 crossTextRelativePosX : [0,-2,4,0,-2,4,0,-2,4],
 crossTextRelativePosY : [0,0,0,-2,-2,-2,4,4,4],
See also : crossTextPosX,crossTextPosY, crossTextRelativePosX, crossTextRelativePosY
Previous Chapter Previous Page Next Page Next Chapter Top of Page