100_080_In_Graph_Data
Previous Chapter Previous Page Next Page Next Chapter Table of content
With ChartNew.js, you can put information about the data inside the chart.
Through options, you can :
- define the location of the displayed information;
- format the displayed text.
Samples :

For the explanations of the “In Graph (Chart) Data” options, we will proceed differently. First, the general options associated to the layout of the displayed text will be explained. Then, per chart type, all options than set the place of the text in the chart will be explained.
- General options
- In Graph (Chart) Data position for “Line” charts
- In Graph (Chart) Data position for “Bubbles” charts
- In Graph (Chart) Data position for “Bar”/”HorizontalBar”/”StackedBar”/”HorizontalStackedBar” chart
- In Graph (Chart) Data position for “Pie”/”DoughtNut”/”PolarArea” chart
- In Graph (Chart) Data position for “radar” chart
Description : Per default, “in Graph (Chart) Data” are not displayed; set option inGraphDataShow to true if you want to display the “in Graph (Chart) Data”.
Chart types : All
Values : true or false or an array or a function
Default value : false
Sample : inGraphDataShow : true
See also :
Description : the text displayed in the “in Graph (Chart) Data” can be fully specified by the user through a template description that uses available variables. Template usage is described in chapter “Templates”; Available variables are described in chapter “Template variables”;
Chart types : All
Values : a template text description (see chapter “Templates”) or an array or a function.
Default value : The default value is different for all chart type… Try and adapt if you want
Samples :
inGraphDataTmpl : "<%=v3%>"-
inGraphDataTmpl : "<%=v1%>\n<%=v4%>"You can use a\nfor a new line
See also :
Text layout options
Description : specify the color of the font in the “in Graph (Chart) Data” with option inGraphDataFontColor
Chart type : all
Values : any valid color or an array or a function
Default value : "#666"
Sample : inGraphDataFontColor : "black"
See also :
Description : specify the font for the text in the “in Graph (Chart) Data” with option inGraphDataFontFamily
Chart type : all
Values : any valid font or an array or a function
Default value : "'Arial'"
Sample :
See also :
Description : specify the size of the font for the text in the “In Graph (Chart) Data” with option inGraphDataFontSize
Chart type : all
Values : any positive integer or an array or a function
Default value : 12
Sample : inGraphDataFontSize : 10
See also :
Description :specify the style of the font for the text in the « in Graph (Chart) Data » with option inGraphDataFontStyle
Chart type : all
Values : any vallid font style or an array or a function
Default value : "normal"
Sample : inGraphDataFontStyle : "italic"
See also :
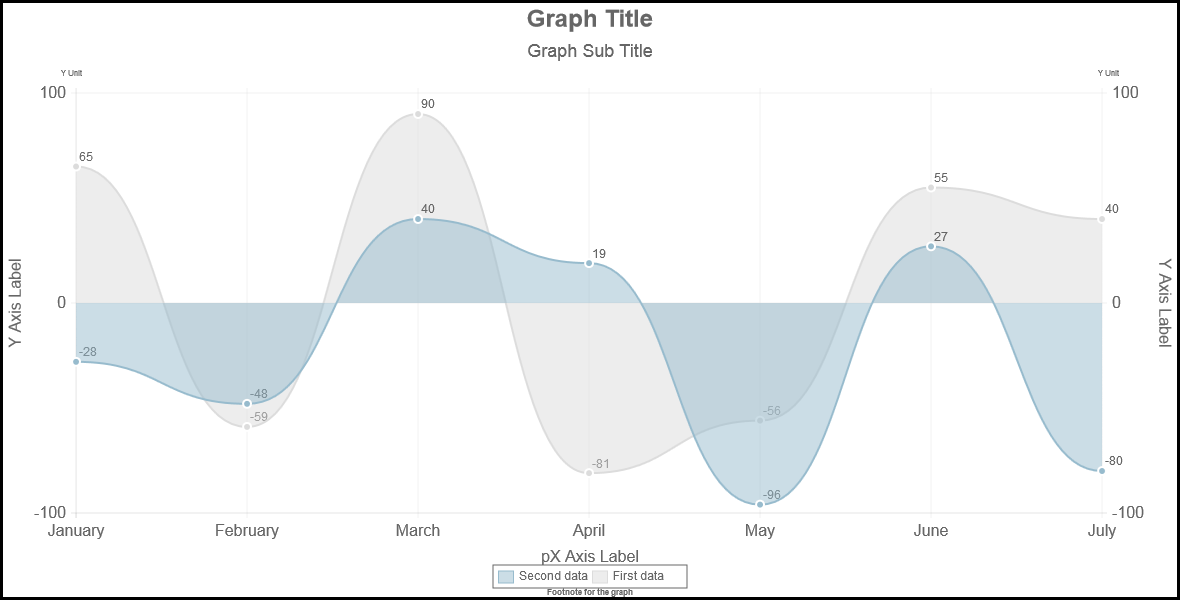
Associated to each point on the line, “in graph (chart) data” will be displayed. First of all, through the options inGraphDataPaddingX and inGraphDataPaddingY, you specify a location in reference to the point on the line. This location will be called the “In Graph (Chart) Position”. This position is a pixel on your canvas.
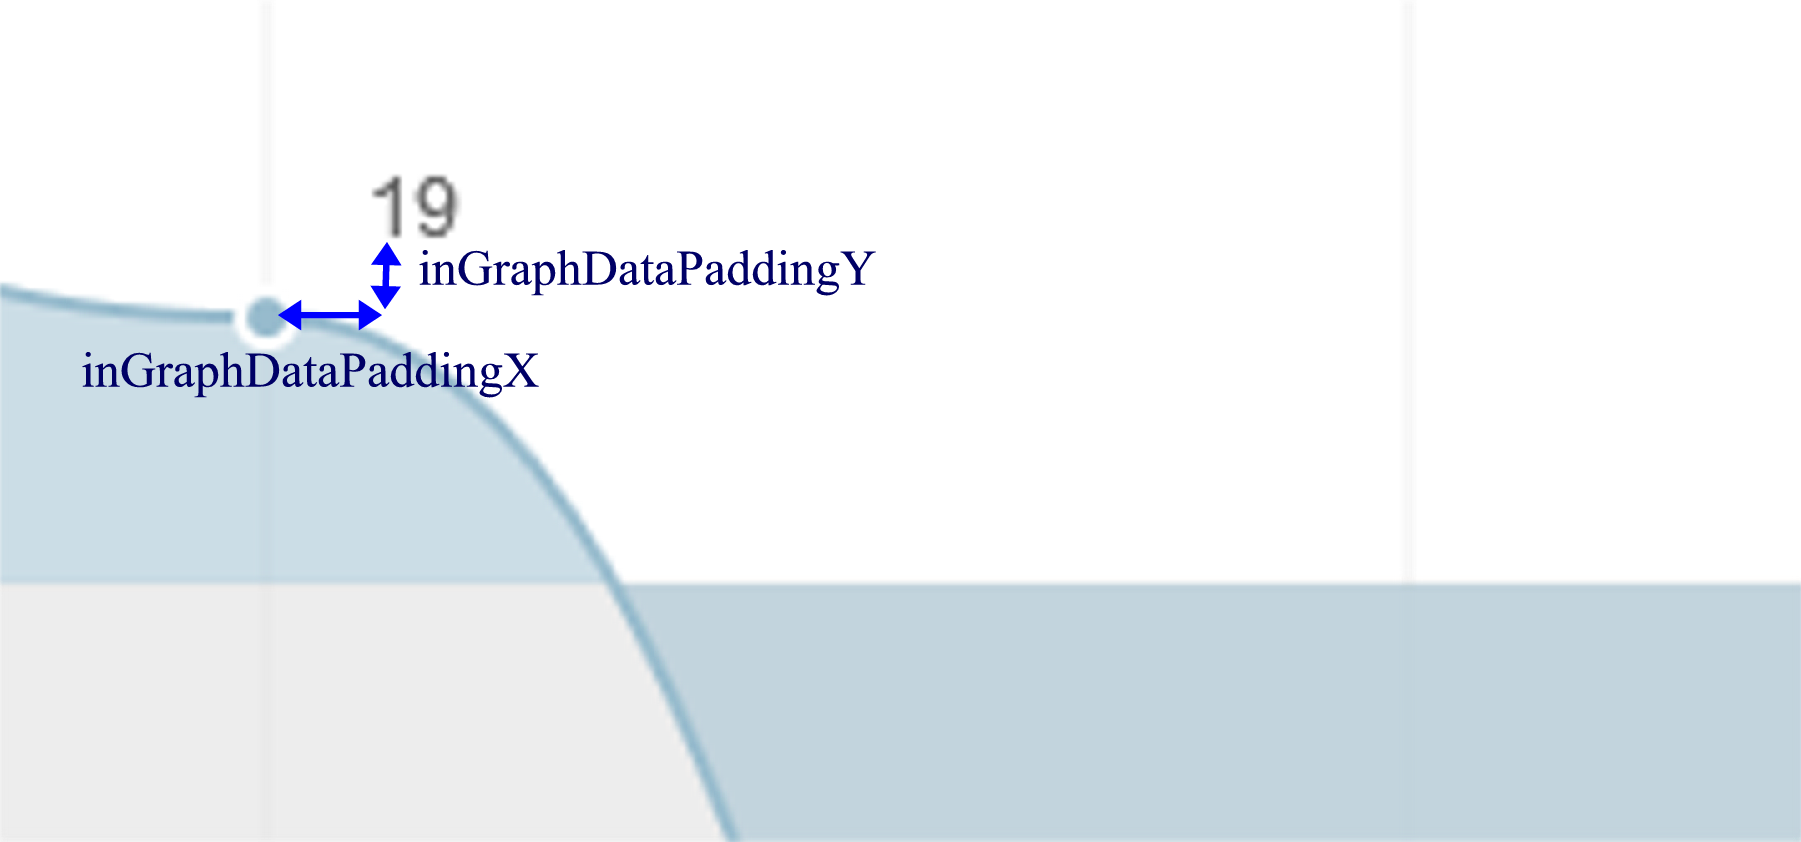
Description : With option inGraphDataPaddingX, you can specify the space in pixel on the X axis between the point on the line and the “In Graph (Chart) Position”
Values : any integer (positive or negative) or an array or a function
Default value : 3
Sample : inGraphDataPaddingX : 6
See also : inGraphDataPaddingY
Description : With option inGraphDataPaddingY, you can specify the space in pixel on the Y axis between the point on the line and the “In Graph (Chart) Position”
Values : any integer (positive or negative) or an array or a function
Default value : -3 (negative values if you want to display the text over the point)
Sample : inGraphDataPaddingY : -6
See also : inGraphDataPaddingX
Description : the “In graph (Chart) data” text can be rotated in the canvas. Use option inGraphDataRotate to specify the rotation angle.
Values : any real value or an array or a function
Default value : 0 ( no rotation)
Sample : inGraphDataRotate : 45
See also :
Description : with options inGraphDataPaddingX and inGraphDataPaddingY, you determine the “In Graph (Chart) Position”. Now with option inGraphDataAlign, you specify how to horizontally align the text to the “In Graph (Chart) Position”
Values : "left", "center", "right" or an array or a function
Default value : "left"
Sample : inGraphDataAlign : "center"
See also :
Description : with options inGraphDataPaddingX and inGraphDataPaddingY, you determine the “In Graph (Chart) Position”. Now with option inGraphDataVAlign, you specify how to align vertically the text to the “In Graph (Chart) Position”
Values : "top", "middle", "bottom" or an array or a function
Default value : "bottom"
Sample : inGraphDataVAlign : "middle"
See also :
Associated to each bubble, “in graph (chart) data” will be displayed. First of all, through the options inGraphDataPaddingX and inGraphDataPaddingY, you specify a location in reference to the center of the bubble. This location will be called the “In Graph (Chart) Position”. This position is a pixel on your canvas.
Description : With option inGraphDataPaddingX, you can specify the space in pixel on the X axis between the border of the bubble and the “In Graph (Chart) Position”
Values : any integer (positive or negative) or an array or a function
Default value : 0 (<=> display at the center)
Sample : inGraphDataPaddingX : 6
See also : inGraphDataPaddingY
Description : With option inGraphDataPaddingY, you can specify the space in pixel on the Y axis between the border of the bubbleand the “In Graph (Chart) Position”
Values : any integer (positive or negative) or an array or a function
Default value : 0 (<=> at the center of the bubble)
Sample : inGraphDataPaddingY : -6
See also : inGraphDataPaddingX
Description : the “In graph (Chart) data” text can be rotated in the canvas. Use option inGraphDataRotate to specify the rotation angle.
Values : any real value or an array or a function
Default value : 0 ( no rotation)
Sample : inGraphDataRotate : 45
See also :
Description : with options inGraphDataPaddingX and inGraphDataPaddingY, you determine the “In Graph (Chart) Position”. Now with option inGraphDataAlign, you specify how to horizontally align the text to the “In Graph (Chart) Position”
Values : "left", "center", "right" or an array or a function
Default value : "center"
Sample : inGraphDataAlign : "center"
See also :
Description : with options inGraphDataPaddingX and inGraphDataPaddingY, you determine the “In Graph (Chart) Position”. Now with option inGraphDataVAlign, you specify how to align vertically the text to the “In Graph (Chart) Position”
Values : "top", "middle", "bottom" or an array or a function
Default value : "middle"
Sample : inGraphDataVAlign : "middle"
See also :
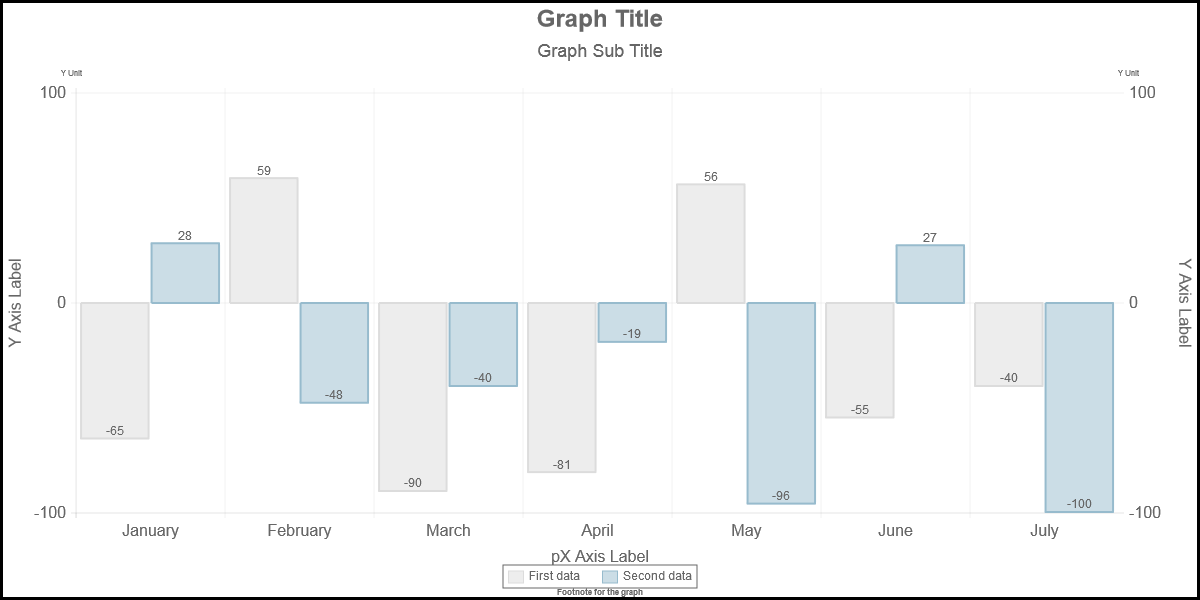
Associated to each bar in the chart, “in graph (chart) data” will be displayed. First of all, through the options inGraphDataXposition and inGraphDataYPosition (and inGraphDataPaddingX and inGraphDataPaddingY), you specify a location in reference to the bar. This location will be called the “In Graph (Chart) Position”. This position is a pixel on your canvas. “Bar”, “StackedBar”, “HorizontalBar” and “HorizontalStackedBar” have the same parameters for “In Graph (Chart) Data” but have different default values.
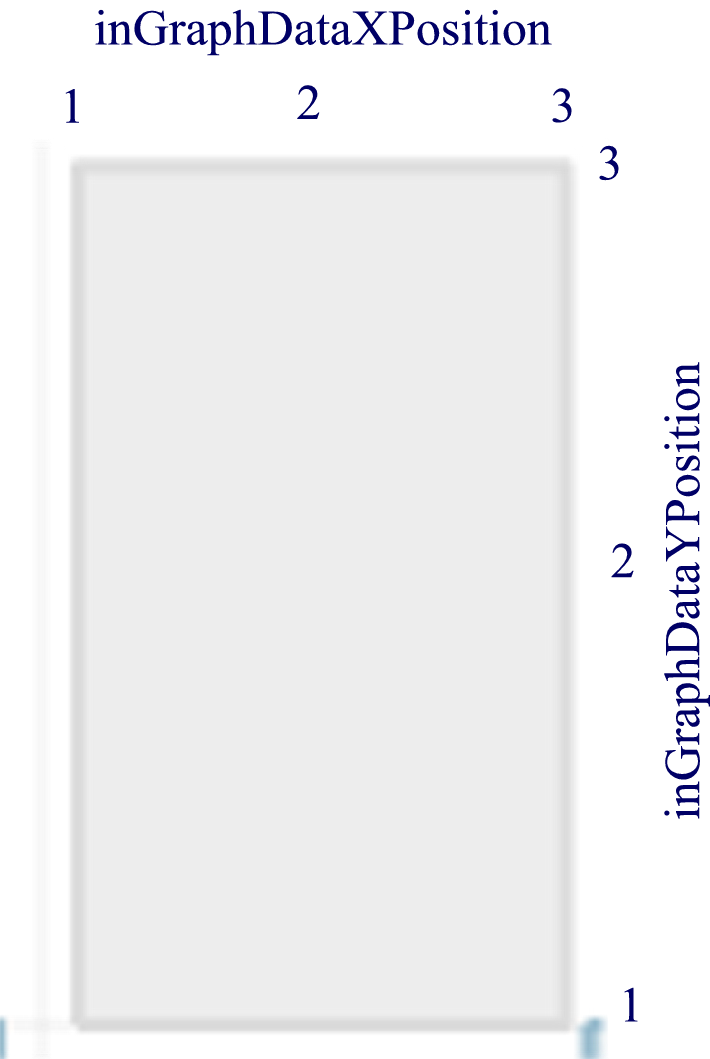
Description : with inGraphDataXPosition, you specify where is the “In Graph (Chart) Position” horizontally in the bar.
Values : 1, 2 or 3 or an array or a function
- 1 : the left border of the bar
- 2 : the center of the bar
- 3 : the right of the bar
Default value :
- 2 for bar and stackedBar
- 3 for horizontalBar and horizontalStackedBar
Sample : inGraphDataXPosition : 1
See also :
Description : with inGraphDataYPosition, you specify where is the “In Graph (Chart) Position” vertically in the bar.
Values : 1, 2 or 3 or an array or a function
- 1 : the bottom border of the bar
- 2 : the middle of the bar
- 3 : the top of the bar
Default value :
- 3 for bar and stackedBar
- 2 for horizontalBar and horizontalStackedBar
Sample : inGraphDataYPosition : 2
See also :
Description : with options inGraphDataXPosition and inGraphDataYPosition, you have defined a relative position; You can shift the “in graph (chart) position” with a specific amount of pixel on the right or on the left with option inGraphDataPaddingX Values : any integer (positive for a shift on the right or negative for a shift on the left) or an array or a function
Default value :
- 0 for bar and stackedBar
- 3 for horizontalBar
- -3 for horizontalStackedBar
Sample : inGraphDataPaddingX : 3
See also :
Description : with options inGraphDataXPosition and inGraphDataYPosition, you have defined a relative position; You can shift the “in graph (chart) position” with a specific amount of pixel to the top or to the bottom with option inGraphDataPaddingY
Values : any integer (positive for a shift to the bottom or negative for a shift on the top) or an array or a function
Default value :
- 3 for bar
- -3 for stackedBar
- 0 for horizontalBar and horizontalStackedBar
Sample : inGraphDataPaddingY : -3
See also :
Description : the “In graph (chart) data” text can be rotated in the canvas. Use option inGraphDataRotate to specify the rotation angle.
Values : any real value or an array or a function
Default value : 0 (<=> no rotation)
Sample : inGraphDataRotate : 45
See also :
Description : with options options inGraphDataXposition and inGraphDataYPosition (and inGraphDataPaddingX and inGraphDataPaddingY), you determine the “In Graph (Chart) Position”. Now with option inGraphDataAlign, you specify how to horizontally align the text to the “In Graph (Chart) Position”
Values : “left”, “center”, “right” or an array or a function
Default value :
- “center ” for bar and stackedBar
- “right” for horizontalSstackedBar
- “left” for horizontalBar
Sample : inGraphDataAlign : "left"
See also :
Description : with options options inGraphDataXposition and inGraphDataYPosition (and inGraphDataPaddingX and inGraphDataPaddingY), you determine the “In Graph (Chart) Position”. Now with option inGraphDataVAlign, you specify how to align vertically the text to the “In Graph (Chart) Position”
Values : “top”, “middle”, “bottom” or an array or a function
Default value :
- “bottom” for bar
- “top” for stackedBar
- “middle” for horizontalBar and horizontalStackeBar
Sample : inGraphDataVAlign : "center"
See also :
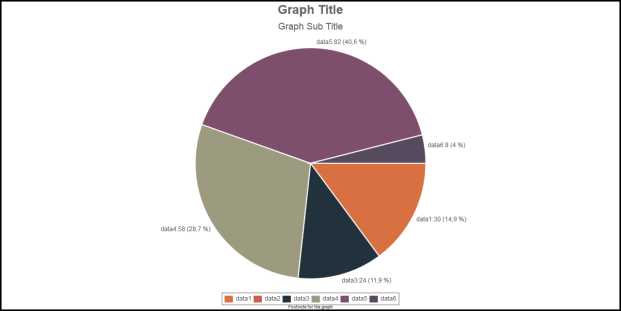
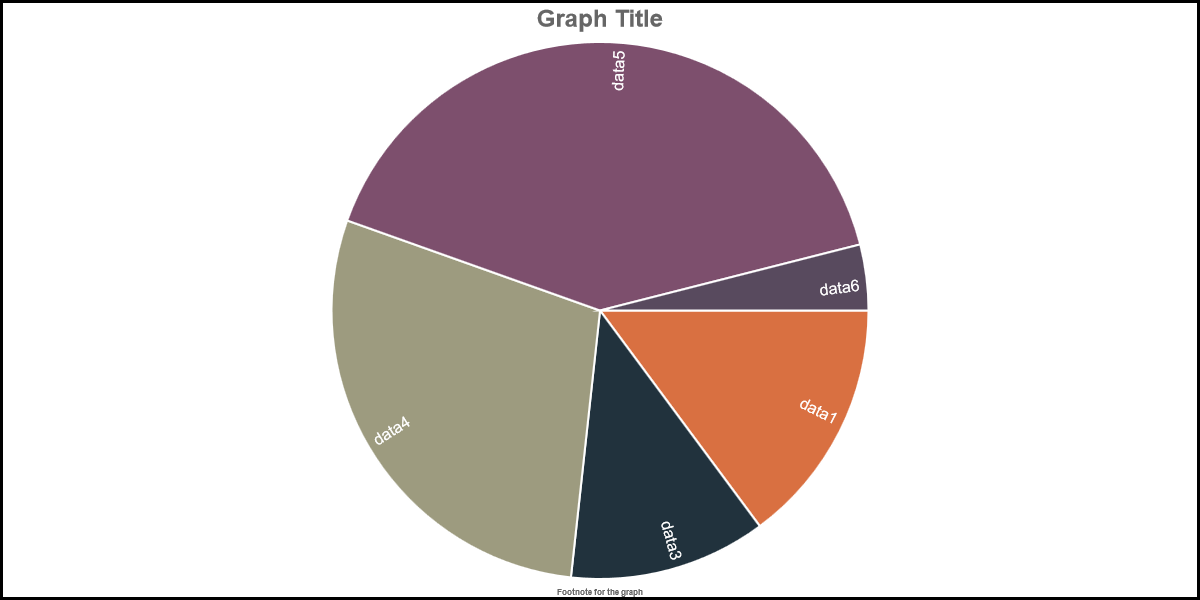
Associated to each piece of cake in the chart, “in graph (chart) data” will be displayed. First of all, through the options inGraphDataAnglePosition and inGraphDataRadiusPosition (and inGraphDataPaddingAngle and inGraphDataPaddingRadius), you specify a location in reference to the piece of cake. This location will be called the “In Graph (Chart) Position”. This position is a pixel on your canvas. “Pie”, “DoughNut” and “PolarArea” have the same parameters for “In Graph (Chart) Data” and the same default values.
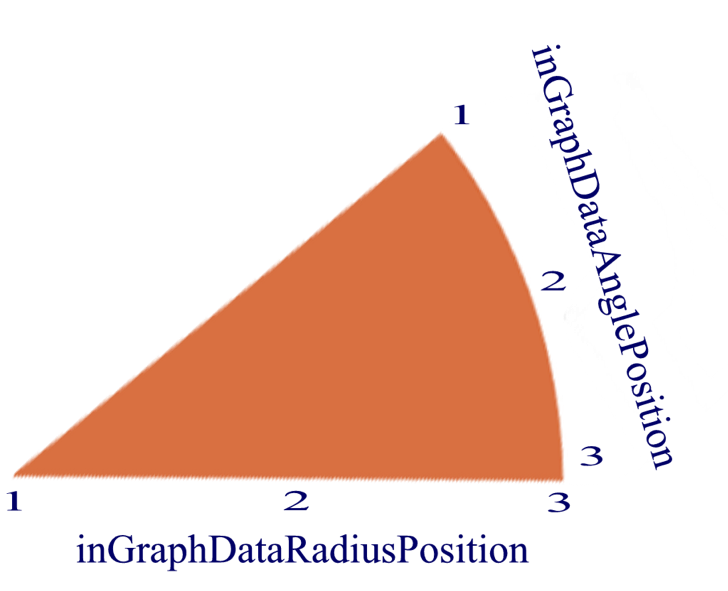
Description : with inGraphDataAnglePosition, you specify the position of “In Graph (Chart) Position” in the angle of the piece of cake.
Values : 1, 2 or 3 or an array or a function
- 1 : at the beginning of the angle
- 2 : the center of the angle
- 3 : at the end of the angle
Default value : 2
Sample : inGraphDataAnglePosition : 1
See also :
Description : If the angle of the piece is lower than inGraphDataMinimumSlice, the "In Graph (Chart) Data" of this piece is not written on the chart. This option is not available for PolarArea charts.
Values : positive integer or an array or a function
Default value : 0
Sample : inGraphDataMinimumAngle : 0
See also :
Description : with inGraphDataRadiusPosition, you specify where is the “In Graph (Chart) Position” ont the radius.
Values : 0 (for doughtnut only), 1, 2 or 3 or an array or a function
- 0 : at the center of the doughtnut
- 1 : at the center of the circle (for doughnut : at the inside border of the doughnut)
- 2 : at the center of the piece of cacke (for doughnut : at the center of the piece of the dougthnut )
- 3 : at the outside border of the piece of cake
Default value : 3
Sample : inGraphDataRadiusPosition : 2
See also :
Description : with options inGraphDataAnglePosition and inGraphDataRadiusPosition, you have defined a relative position; You can shift the “in graph (chart) position” with a specific amount of degres in the angle with option inGraphDataPaddingAngle
Values : any integer (positive for a shift inside the piece of cake or negative for a shift outside the piece of cake) or an array or a function
Default value : 0
Sample : inGraphDataPaddingRadius : 3
See also :
Description : with options inGraphDataAnglePosition and inGraphDataRadiusPosition, you have defined a relative position; You can shift the “in graph (chart) position” with a specific amount of pixels in the radius with option inGraphDataPaddingRadius
Values : any integer (positive for a shift to the external part of the piece of cake or negative for a shift to the center of the circle) or an array or a function
Default value : 0
Sample : inGraphDataPaddingRadius : -3
See also :
Description : the “In graph (chart) data” text can be rotated in the canvas. Use option inGraphDataRotate to specify the rotation angle.
Values : any real value , "inRadiusAxis" or "inRadiusAxisRotateLabels" or an array or a function “inRadiusAxis”/”inRadiusAxisRotateLabels” : If you want to display the "In Graph (Chart) Data" in the angle of the piece of cake, set “inGraphDataRotate to value “inRadiusAxis” or, probably better, “inRadiusAxisRotateLabels”.
Example :
inGraphDataAnglePosition : 2,
inGraphDataRadiusPosition: 2,
inGraphDataRotate : “inRadiusAxisRotateLabels”,
inGraphDataAlign : “center”,
inGraphDataVAlign : “middle”,
inGraphDataFontColor : “white”
Default value : 0 (<=> no rotation)
Sample : inGraphDataRotate : "inRadiusAxisRotateLabels"
See also :
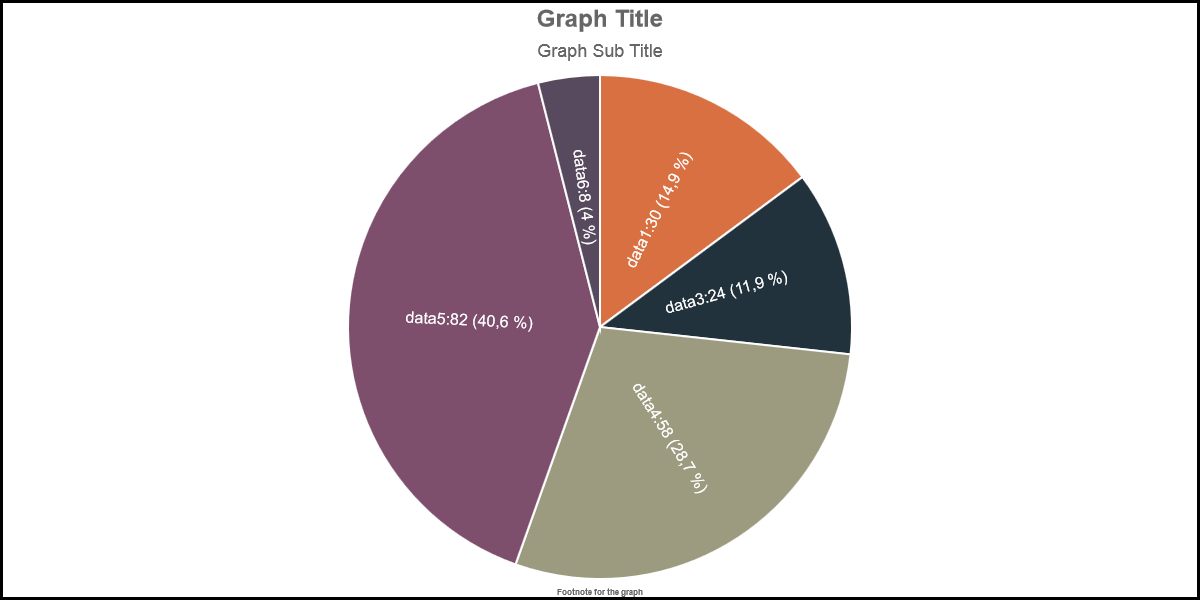
Description : with options options inGraphDataAnglePosition and inGraphDataRadiusPosition (and inGraphDataPaddingAngle and inGraphDataPaddingRadius), you determine the “In Graph (Chart) Position”. Now with option inGraphDataAlign, you specify how to horizontally align the text to the “In Graph (Chart) Position”
Values : “left”, “center”, “right”, “off-center” or “to-center” or an array or a function “off-center” <=> “right” for the pieces of cakes on the right and “left” for the pieces of cakes on the left.
Example :
inGraphDataAnglePosition : 2,
inGraphDataRadiusPosition: 3,
inGraphDataRotate : "inRadiusAxisRotateLabels",
inGraphDataFontSize : 16,
inGraphDataAlign : "off-center",
inGraphDataVAlign : "off-center",
graphTitleSpaceAfter : 40,
footNoteSpaceBefore : 40,
inGraphDataTmpl: "<%=v1%>"
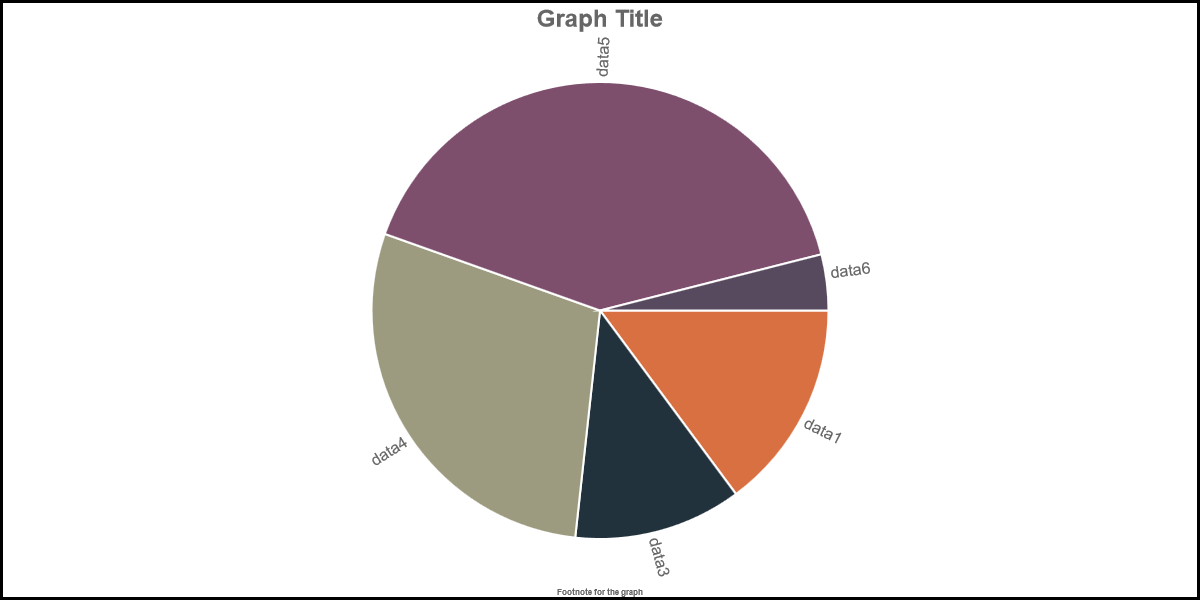
“to-center” <=> “left” for the pieces of cakes on the right and “right” for the pieces of cakes on the right.
Example :
inGraphDataAnglePosition : 2,
inGraphDataRadiusPosition: 3  ,
inGraphDataPaddingRadius : -8,
inGraphDataRotate : "inRadiusAxisRotateLabels",
inGraphDataFontColor : "white",
inGraphDataFontSize : 16,
inGraphDataAlign : "to-center",
inGraphDataVAlign : "to-center",
graphTitleSpaceAfter : 0,
footNoteSpaceBefore : 0 ,
inGraphDataTmpl: "<%=v1%>"
Default value : "off-center"
Sample : inGraphDataAlign : "left"
See also :
Description : with options options inGraphDataAnglePosition and inGraphDataRadiusPosition (and inGraphDataPaddingAngle and inGraphDataPaddingRadius), you determine the “In Graph (Chart) Position”. Now with option inGraphDataVAlign, you specify how to vertically align the text to the “In Graph (Chart) Position”
Values : “top”, “middle”, “bottom”, “off-center” or “to-center” or an array or a function “off-center” <=> “bottom” for the pieces of cakes on the top and “top” for the pieces of cakes on the bottom. “to-center” <=> “top” for the pieces of cakes on the top and “bottom” for the pieces of cakes on the bottom.
Default value : “off-center”
Sample : inGraphDataVAlign : "center"
See also : inGraphDataAlign
Specifications for "In Graph (Chart) Data" for radar chart is the same as "In Graph (Chart) Data" for Pie Chart except that the options inGraphDataAnglePosition and inGraphDataPaddingAngle does not exist.
Previous Chapter Previous Page Next Page Next Chapter Top of Page