033_version_3
Previous Page Next Page Table of content
This chapter describes the changes performed to ChartNew.js through version 3 (June 2016).
New charts
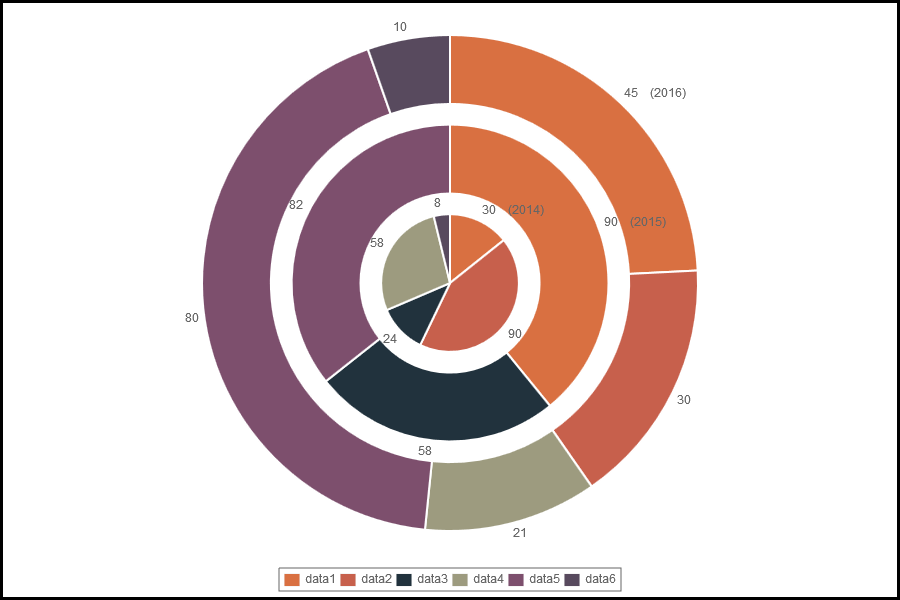
In version 3, there is no new charts, but ... Pie/Doughnut/PolarArea charts have been updated to allow multiple layers.
Data structure
Up to version 2, two completely different data structures were used : lines, bar (all types) and radar charts had one data structure ; pie, doughnut and polarArea charts had another. Since version 3, the data structure used for Pie, doughtnut and polarArea is now identical to the data structure of the other charts ! This changes simplifies the source code and the wiki documentation.
In order to remain compatible with Nick's version, the old data structure is still valid if passed as parameter to a chart, but it will no more be supported through issues.
This changes implies some migration actions for Pie/Doughnut/PolarArea charts (see further in this wiki page).
All samples delivered with ChartNew.js have been updated to the new structure.
New Options
No real changes to the options in version 3. Options "money", "currency" and "currencyPosition" have been added, but it is not related to the upgrade to version 3.
See description in wiki document Format
Migration actions
Because the data structure for Pie/Doughnut/PolarArea changes, it could be that several adaptations have to be brought to your code if you use one of those 3 chart types. For other chart types, no action is required.
Because the old data structure for those 3 chart types is no more supported through issues, it is strongly recommanded to migrate to the new data structure. To help you doing this, you can temporarily set option "generateConvertedData" to true; When set, the data variable in the new format is displayed in the console log.
However, actions are required in two cases :
Case 1 : if you set the value to one of the template options (inGraphDataTmpl, scaleLabel, scaleLabel2, annotateLabel)
Because of the new data structure, variables available in templates have been renamed to what we have for the other charts.
For instance, in the old structure, the "value" was associated to variable "v2"; In the new structure, the value is now associated to variable "v3" (such as for the other charts). So if you use "v2" in your template, you have to replace it by "v3".
For the Pie/Doughnut/PolarArea chart types, the default value for the template variables have been updated to achieve the same result to what was displayed in those charts with version 2.
See Wiki document https://github.com/FVANCOP/ChartNew.js/wiki/120_Template_variables for a complete list of variable changes.
Case 2 : if you have a function associated to an option
In the user written functions associated to options, the data variable is passed as parameter. Because the structure of the data changes, you will have to perform some changes in your function if you use the data variable in the code of the function.
What do you have to change in the code ? "data[i].value" has to be changed to "data.datasets[i].data[0]"