100_035_DoubleAxis
Previous Chapter Previous Page Next Page Next Chapter Table of content
In previous chapter, options associated to axis are described. But ... some options were not described there. If you want, for some chart types, you can have two different Y axis.
Example:
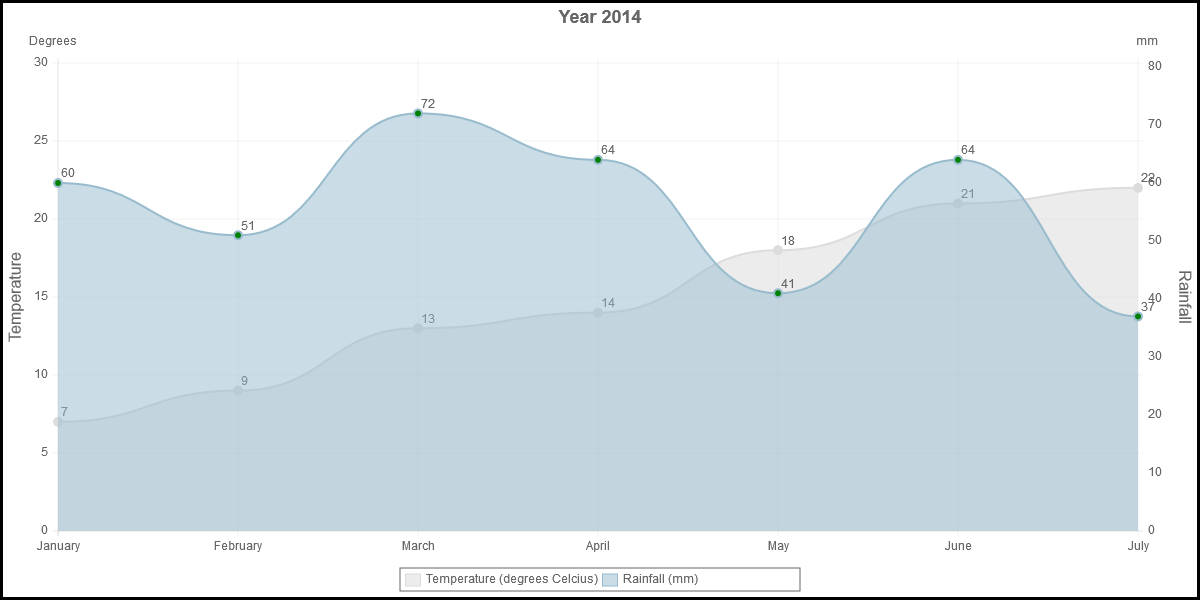
In this example, on the left axis, there is a scale for the temperature; On the right axis, there is another scale for the rainfall.
Charts types that can have two axis : Line and Bar. For StackedBar the second axis can only be associated to a line (line can be drawn in Bar and StackedBar charts).
How to define two axis : in the dataset, specify "axis:1" if the data refer to the left axis; specify "axis:2" if the data refer to the right axis.
Example:
 var mydata = {
    labels : ["January","February","March","April","May","June","July"],
    datasets : [
           {
		     fillColor : "rgba(151,187,205,0.5)",
		     strokeColor : "rgba(151,187,205,1)",
		     pointColor : "green",
		     pointstrokeColor : "yellow",
		     data : [60,51,72,64,41,64,37],
		     axis : 2,
		     title : "Rainfall (mm)"
           },
           {
		     fillColor : "rgba(220,220,220,0.5)",
		     strokeColor : "rgba(220,220,220,1)",
		     pointColor : "rgba(220,220,220,1)",
		     pointstrokeColor : "yellow",
		     data : [7,9,13,14,18,21,22],
		     axis : 1,
		     title : "Temperature (degrees Celcius)"
           }
    ]
 }
 var opt1 = {
  canvasBorders : true,
  graphTitle : "Year 2014",
  legend : true,
  inGraphDataShow : true,
  graphTitleFontSize: 18,
  yAxisRight : true ,
  yAxisUnit : 'Degrees',
  yAxisLabel : 'Temperature',
  yAxisUnit2 : 'mm',
  yAxisLabel2 : 'Rainfall',
  yAxisUnitFontSize: 12,
  yAxisMinimumInterval : 5,
  yAxisMinimumInterval2 : 10,
  graphMin : 0,
  graphMin2 : 0
 }
Attention : the second Y Axis will only be displayed if the option yAxisRight is set to true.
Several options are associated to the second axis; There will not be described here. For a description of them see the corresponding options on the primary axis (same name, without the '2' at the end). Options associated to the second axis :
Description : the second axis Axis is computed on basis of the data associated to the second axis. If you don't have data associated to the second axis, the second axis will be identical to the first axis even if scaleOverride2 option is set to true. If you want to force the second axis to be displayed according the "override" options, you have to set option forceSecondScale to true.
Chart types : line, Bubbles, bar, stackedBar, horizontalBar, horizontalStackedBar
Values : true or false
Default value : false
Sample : forceSecondScale: true
See also :
Previous Chapter Previous Page Next Page Next Chapter Top of Page