130_option_functions
Previous Page Next Page Table of content
For several options or dataset/data elements instead of specifying a value, you can specify a function. In this chapter, we will explain how to use such a function.
Example :
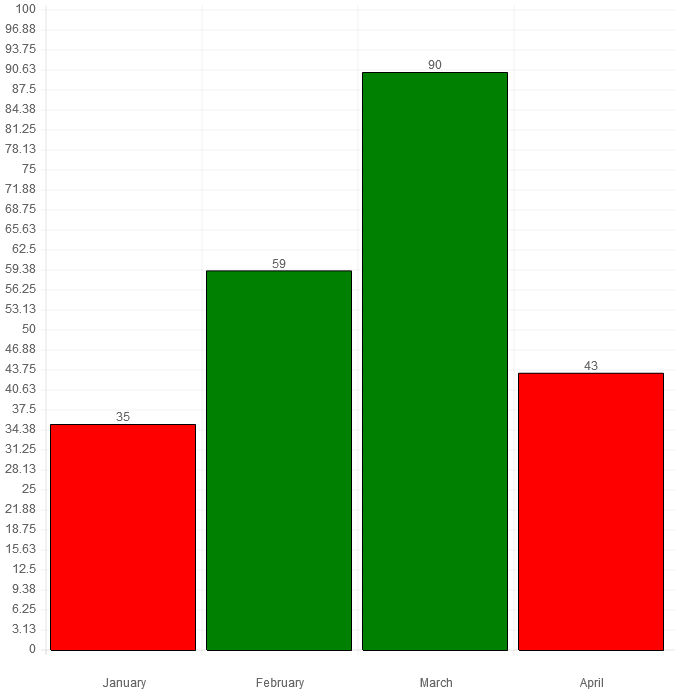
In your bar chart, you want to assign the color “RED” to the bars for which the value is below 50 and the color “GREEN” for the bars for which the value is over 50.
var myoptions = {
  inGraphDataShow : true,
  roundNumber : -2,
  graphMin : 0,
  graphMax : 100
}

function setColor(area,ctx,data,statData,posi,posj,othervars)
{
  if(1*data[i] < 50)return("RED");
  else return("GREEN");
}

var data = {
labels : ["January","February","March","April"],
datasets : [
	{
		fillColor : setColor,
		strokeColor : "BLACK",
		data : [35,59,90,43],
		title : "Year 2014"
	}
]
}
When a function is assigned to an option or datasets/data element, the function will be called each time the associated value has to be evaluated.
The function has 7 parameters :
function myfunction(area,ctx,data,statData,posi,posj,othervars) {
...
}
The value of area will be a fixed string with a specific value. The purpose of this parameter is only to make possible to write a single function for several options and to differentiate when the call is done : for instance, the value of "area" will be different if the function is called to initialize the color of a bar in a chart or to initialize the color for the legend. If you have to use this parameter in your function, check in the code of ChartNew.js which value is associated to this variable or perform test/debug operations to display the values received.
For instance, we adapt previous sample like this:
var myoptions = {
roundNumber : -2,
graphMin : 0,
graphMax : 100,
barStrokeWidth : 10
}
function setColor(area,data,config,i,j,animPct,value,typegraph,ctx,v0,v1,v2,v3)
{
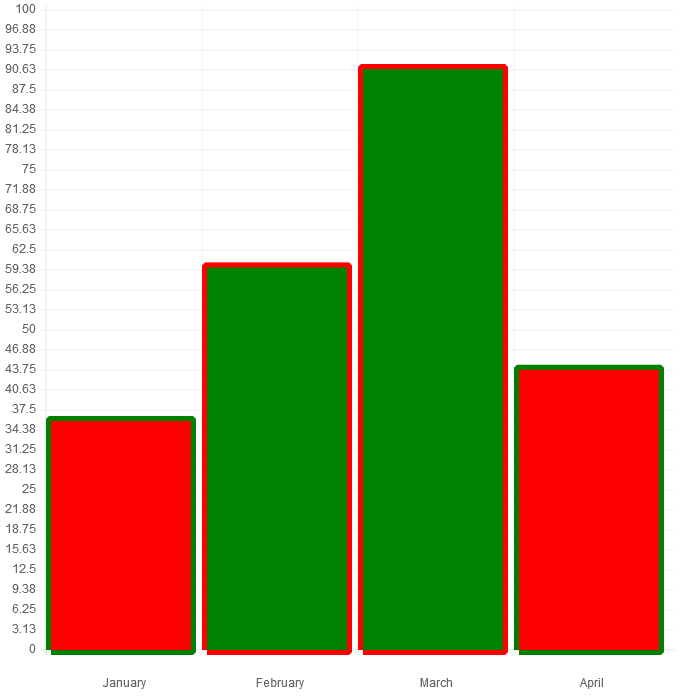
if(area=="FILLCOLOR")
{
if(value < 50)return("RED");
else return("GREEN");
}
if(area=="STROKECOLOR")
{
if(value < 50)return("GREEN");
else return("RED");
}
}
var data = {
labels : ["January","February","March","April"],
datasets : [
{
fillColor : setColor,
strokeColor : setColor,
data : [35,59,90,43],
title : "Year 2014"
}
]
}
The second parameter points to the context.
The third parameter is a pointer to the data passed to the Chart function as first parameter.
function setColor(area,ctx,data,statData,posi,posj,othervars)
{
(...)
}
new Chart(document.getElementById("canvas").getContext("2d")).Bar(data,myoptions);
“posi” and “posj” are associated to the data currently displayed. In following chart, the value of “posi” and “posj” are displayed in the chart.
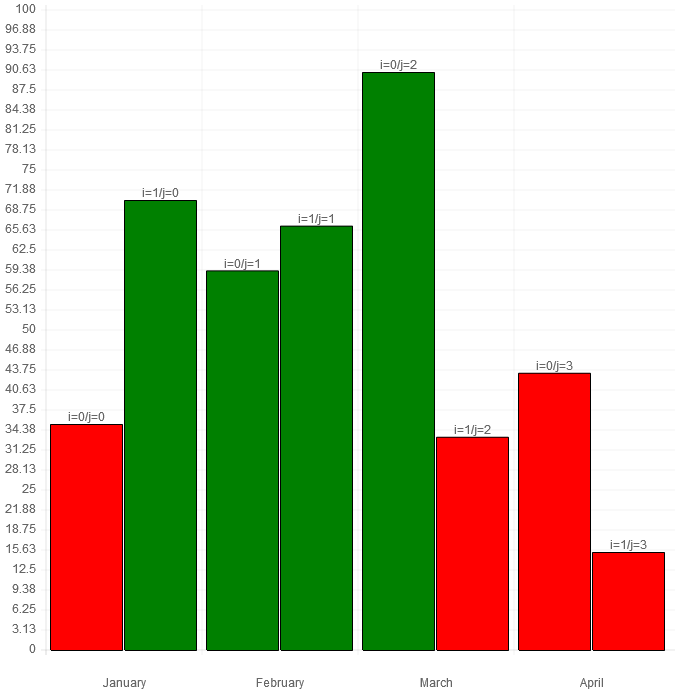
In Line, Radar, Bar, HorizontalBar, StackedBar and HorizontalStackedBar, data[posi][posj] is the value in the datasets for which the function is called.
For Pie, Doughnut and PolarArea charts, posj is always equal to “-1”; data[posi] is the value in the data for which the function is called.
When there is no sense to pass a value for posi and/or posj, (for instance, it happens when the legend is drawn in the context), the value passed for posi and/or posj can be -1.
Sometime, other parameters can be required by your function. It was for instance the case for the function that draw the gradient color (Add-ins/gradientColor.js contains an "option function"). When other parameters are required for a function, the code of ChartNew.js has to be updated : the additionnal variables have to be added in the variable "othervars" which is an array of variables.
A good sample of using those parameters can be bound in Add-ins "gradientColor.js". In this Add-ins, you will see how gradient color can be implemented in charts.