100_115_Multiple_Charts
Previous Chapter Previous Page Next Page Next Chapter Table of content
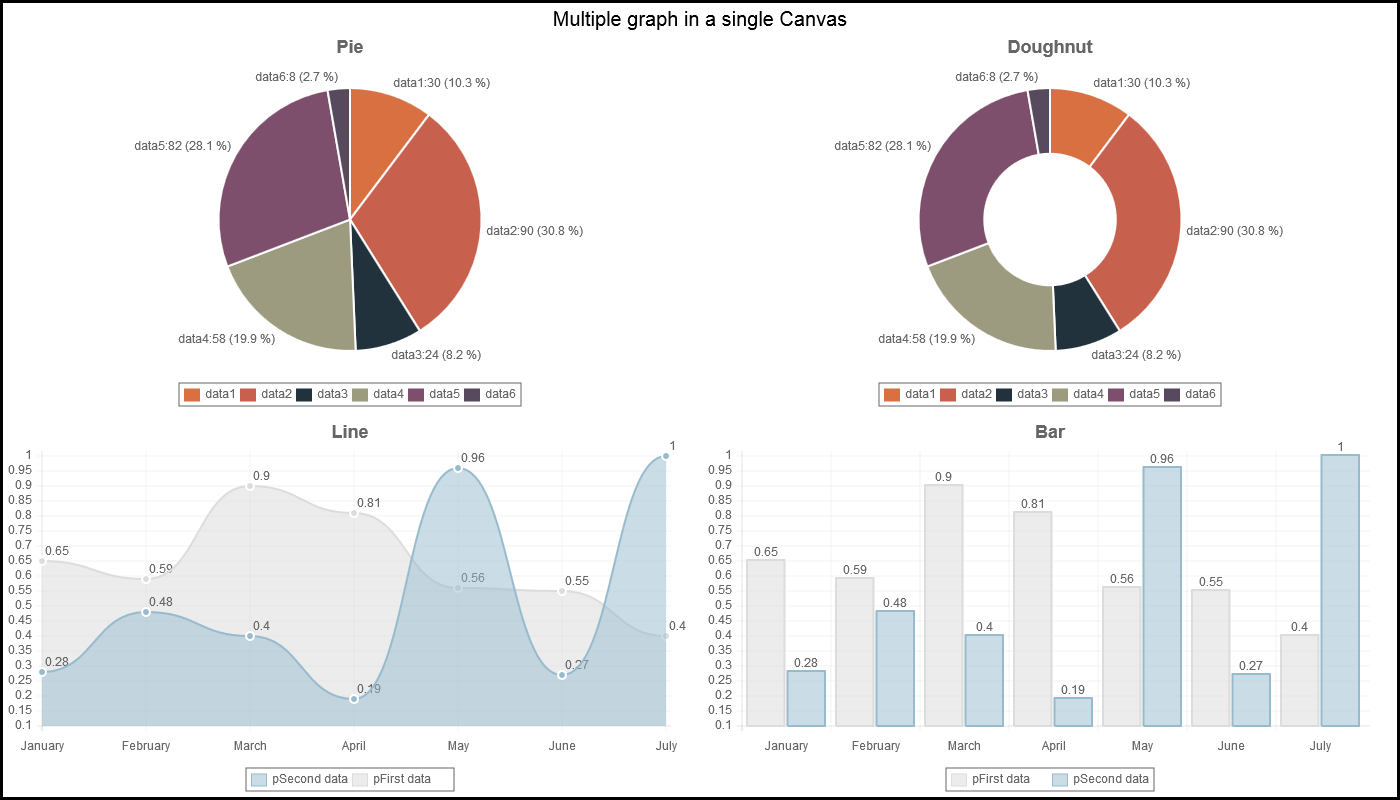
With ChartNew.js, it is possible to draw more than one chart in the same canvas.
When multiple charts are drawn on a canvas, the option savePng cannot be used.
When you plot multiple charts on a canvas, you have to use the options spaceTop, spaceBottom, spaceRight and spaceLeft in order to define the place of each chart in the canvas. You can also use the crossText options if you want to draw a title on the canvas.
Example :
 <!doctype html>
 <SCRIPT src='../ChartNew.js'></script>
 <SCRIPT>
 defCanvasWidth=1400;
 defCanvasHeight=800;
 var mydata1 = {
labels : ["January","February","March","April","May","June","July"],
datasets : [
	{
		fillColor : "rgba(220,220,220,0.5)",
		strokeColor : "rgba(220,220,220,1)",
		pointColor : "rgba(220,220,220,1)",
		pointStrokeColor : "#fff",
		data : [0.65,0.59,0.90,0.81,0.56,0.55,0.40],
                    title : "pFirst data"
	},
	{
		fillColor : "rgba(151,187,205,0.5)",
		strokeColor : "rgba(151,187,205,1)",
		pointColor : "rgba(151,187,205,1)",
		pointStrokeColor : "#fff",
		data : [0.28,0.48,0.40,0.19,0.96,0.27,1.00],
                    title : "pSecond data"
	}
]
 }
 var mydata2 = [
{
	value : 30,
	color: "#D97041",
            title : "data1"
},
{
	value : 90,
	color: "#C7604C",
            title : "data2"
},
{
	value : 24,
	color: "#21323D",
            title : "data3"
},
{
	value : 58,
	color: "#9D9B7F",
            title : "data4"
},
{
	value : 82,
	color: "#7D4F6D",
            title : "data5"
},
{
	value : 8,
	color: "#584A5E",
            title : "data6"
}
 ]
 var opt1 = {
  multiGraph : true,
  canvasBorders : true,
  canvasBordersWidth : 3,
  canvasBordersColor : "black",
  graphTitle : "Pie",
  legend : true,
  inGraphDataShow : true,
  annotateDisplay : true,
  graphTitleFontSize: 18,
  spaceTop : 30,
  spaceBottom : (defCanvasHeight-30)/2,
  spaceRight : defCanvasWidth/2,
  crossText : ["Multiple graph in a single Canvas"],
  crossTextIter : ["first"],
  crossTextRelativePosX : [-2],
  crossTextRelativePosY : [0],
  crossTextPosY : [20],
  crossTextFontSize : [20],
  crossTextFontColor : ["black"]
 }
 var opt2 = {
  multiGraph : true,
  canvasBorders : true,
  canvasBordersWidth : 3,
  canvasBordersColor : "black",
  graphTitle : "Doughnut",
  legend : true,
  inGraphDataShow : true,
  annotateDisplay : true,
  graphTitleFontSize: 18,
  spaceTop : 30,
  spaceBottom : (defCanvasHeight-30)/2,
  spaceLeft : defCanvasWidth/2
 }
 var opt3 = {
  multiGraph : true,
  canvasBorders : true,
  canvasBordersWidth : 3,
  canvasBordersColor : "black",
  graphTitle : "Line",
  legend : true,
  inGraphDataShow : true,
  annotateDisplay : true,
  graphTitleFontSize: 18,
  spaceTop : 30 +(defCanvasHeight-30)/2,
  spaceRight : defCanvasWidth/2
 }
 var opt4 = {
  multiGraph : true,
  canvasBorders : true,
  canvasBordersWidth : 3,
  canvasBordersColor : "black",
  graphTitle : "Bar",
  legend : true,
  inGraphDataShow : true,
  annotateDisplay : true,
  graphTitleFontSize: 18,
  spaceTop : 30 +(defCanvasHeight-30)/2,
  spaceLeft : defCanvasWidth/2,
 }
 </SCRIPT>
 <html>
   <meta http-equiv="Content-Type" content="text/html;charset=utf-8" />
<head>
	<title>Demo ChartNew.js</title>
</head>
<body>
    <center>
    <FONT SIZE=6><B>Demo of ChartNew.js !</B></FONT>    <BR>
    <script>
    var ctx;
    document.write("<canvas id=\"canvas_Multigraph\" height=\""+defCanvasHeight+"\" width=\""+defCanvasWidth+"\"></canvas>");
 window.onload = function() {
     var myGraph = new Chart(document.getElementById("canvas_Multigraph").getContext("2d"))
     myGraph.Pie(mydata2,opt1,myGraph);
     myGraph.Doughnut(mydata2,opt2,myGraph);
     myGraph.Line(mydata1,opt3,myGraph);
     myGraph.Bar(mydata1,opt4,myGraph);
 }
 </script>
 </body>
 </html>
Important to note : In the call of the chart, the canvas himself (mygraph) is passed as third parameter; The option "multiGraph : true" has been set in the options of all charts.
Description: If you want to put multiple charts on a single canvas, you have to set the option "multiGraph" to true.
Chart types: all.
Values: true or false
Default value: false
Sample: multiGraph : true
See also: spaceTop, spaceLeft, spaceRight, spaceBottom, crossText.
Remark : if you want to refresh a multigraph (option multiGraph = true) canvas with new data and if the option annotateDiplay is set to true, you will have problem . In order to avoid problems with the annotate, you should redraw the full canvas and, before you redraw the data, call the function "clearAnnotate(<canvas_id>);".
Previous Chapter Previous Page Next Page Next Chapter Top of Page