070_015_Bubbles
Previous Chapter Previous Page Next Page Next Chapter Table of content
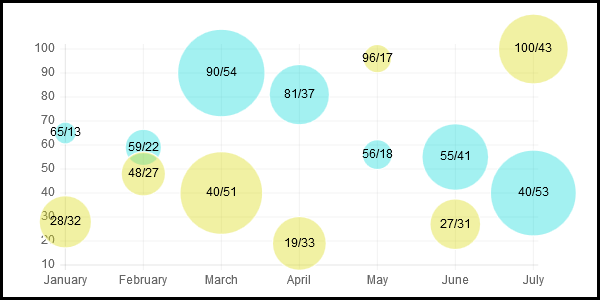
var data = {
labels : ["January","February","March","April","May","June","July"],
datasets : [
    {
        pointColor : "rgba(25,220,220,0.4)",
        pointStrokeColor : "#fff",
        data : [65,59,90,81,56,55,40],
        pointDotRadius : [13,22,54,37,18,41,53],
        title : "Year 2014"
    },
    {
        pointColor : "rgba(220,220,25,0.4)",
        pointStrokeColor : "#fff",
        data : [28,48,40,19,96,27,100],
        pointDotRadius : [32,27,51,33,17,31,43],
        title : "Year 2013"
    }
]
}
The data structure for the Bubble chart is very similar to the structure of the Line Chart. In fact, Bubble chart is just a variant of the Line Chart. For Bubble charts, you have to specify the ´pointDotRadius´ variable which characterise the radius of the bubble.
The radius is computed according 4 values :
- The pointDotRadius value associated to the point;
- A maximum value (by default, the maximum of all pointDotRadius values - see option bubbleMaxVal)
- A minimum value (by default, 0 - see option bubbleMinVal)
- A proportion value (by default 0.2 - see option bubbleMaxRadius)
The "maximum displayable" radius is computed as the proportion of the minimum between the chart width and the chart height.
Example: if the chart is displayed in an area having a height of 200 pixels and an width of 600 pixels, the minimum between the two is 200. If the proportion is 0.2, the "maximum displayable" radius will be 0.2 x 200 pixels = 40 pixels.
A point with a value equal to the minimum value (3) will have a null radius. A point with a value equal to the maximum value (2) will have the "maximum displayable" radius
See Line structure for additional information.
In Bubbles chart, you can also draw lines.
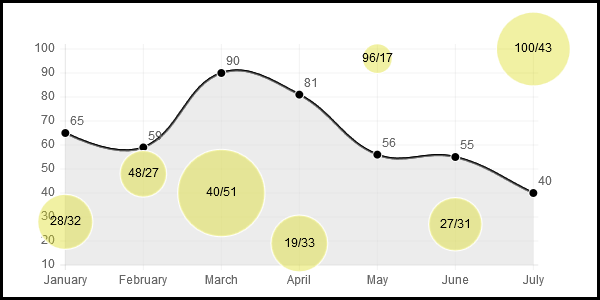
var data = {
labels : ["January","February","March","April","May","June","July"],
datasets : [
    {
        strokeColor : "black",
        pointColor : "rgba(25,220,220,0.4)",
        pointStrokeColor : "#fff",
        data : [65,59,90,81,56,55,40],
        pointDotRadius : 5,
        type: "Line",
        title : "Year 2014"
    },
    {
        pointColor : "rgba(220,220,25,0.4)",
        pointStrokeColor : "#fff",
        data : [28,48,40,19,96,27,100],
        pointDotRadius : [32,27,51,33,17,31,43],
        title : "Year 2013"
    }
]
}
To associate a datasets element to a line, you just have to define 'type : "Line"' in the data.
Previous Chapter Previous Page Next Page Next Chapter Top of Page