080_options
Previous Page Next Page Table of content
By default, you get a "typical" chart, but you can change options in order to produce a chart that will be more attractive or that will be closer to the result you look for.
For instance, by default, a pie chart appears like this :
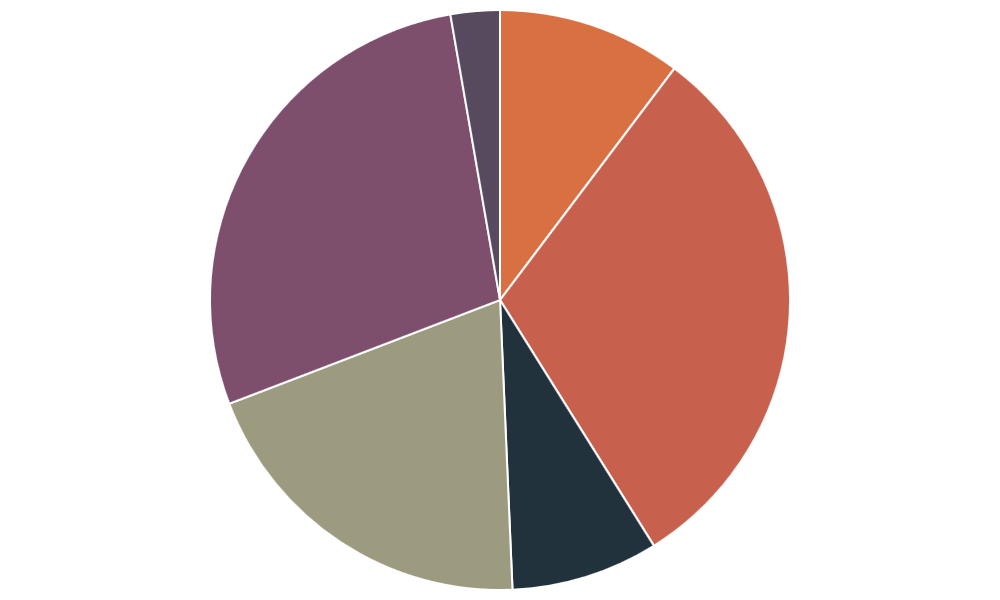
Difficult to read such a chart…. : what is the meaning of each color ?????
With specific options, you can get the following chart that is more readable.
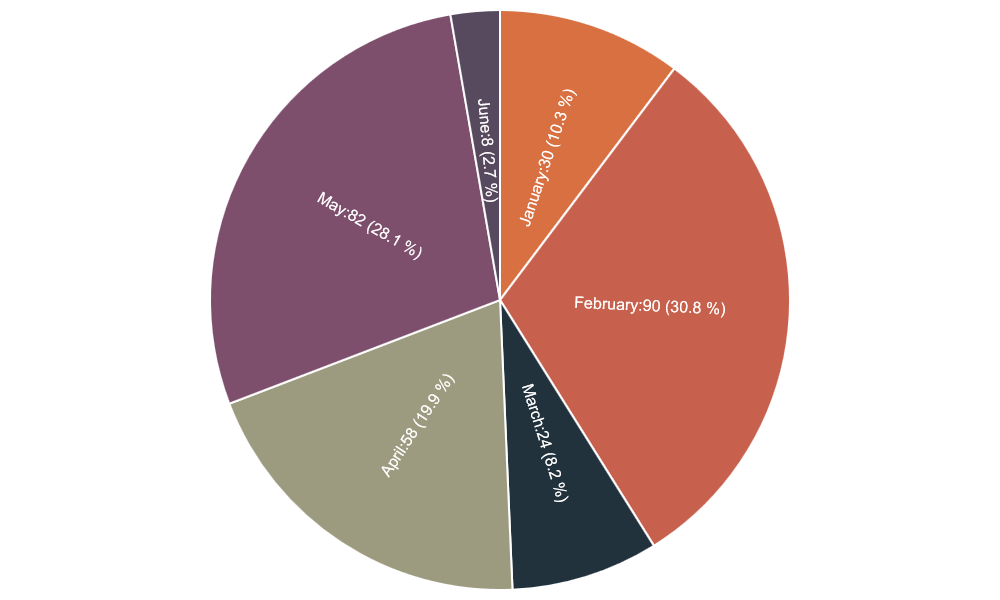
With options, you can change lot of things in your chart : draw a legend, a title, a footnote, a border; change the layout and lot of other things that you will discover.
##How to define options in your Javascript file ?
##Solution 1
Pass your options as an array of values as second parameter – Example : Pie Chart sample.
 window.onload = function() {
 new Chart(document.getElementById("canvas").getContext("2d")).Pie(datapie,
 {    inGraphDataShow : true,
      inGraphDataAnglePosition : 2,
      inGraphDataRadiusPosition: 2,
      inGraphDataRotate : "inRadiusAxisRotateLabels",
      inGraphDataAlign : "center",
      inGraphDataVAlign : "middle",
      inGraphDataFontColor : "white",
      inGraphDataFontSize : 16
 });
 }
##Solution 2
Step 1 : define a variable with your options – Example : options defined for the Pie Chart sample
var myoptions = {
inGraphDataShow : true,
inGraphDataAnglePosition : 2,
inGraphDataRadiusPosition: 2,
inGraphDataRotate : "inRadiusAxisRotateLabels",
inGraphDataAlign : "center",
inGraphDataVAlign : "middle",
inGraphDataFontColor : "white",
inGraphDataFontSize : 16
}
Step 2 : pass your variable to the chart as second parameter – Example : Pie Chart sample.
 window.onload = function() {
 new Chart(document.getElementById("canvas").getContext("2d")).Pie(datapie,myoptions);
 }