170_Math_functions
Previous Page Next Page Table of content
It's possible to compute math values like standard deviation using the chart data and itegrate the value into the chart with annotateLabel or inGraphDataTmpl.
Integrated math functions
- mean
- varianz
- stddev (Standard deviation)
- cv (Coefficient of variation)
If you want to add the difference between the current value and a math function you can add a Dif after the name of the math function. For example:
inGraphDataTmpl: '<%=meanDif()%>' inGraphDataTmpl: '<%=v3-mean()%>'
If you want to have the varianz over each data point:
inGraphDataTmpl: '<%=varianz()%>'
And it's possible to round the data using
inGraphDataTmpl: '<%=varianz(3)%>'
The default number of decimal places is 2
inGraphDataTmpl: '<%=varianz(2)%>' = inGraphDataTmpl: '<%=varianz()%>'
It's possible to add deviation lines into line and bar charts.(math.html)
You can specify which datasets should use a math function using drawMathDeviation.
Every deviation has a
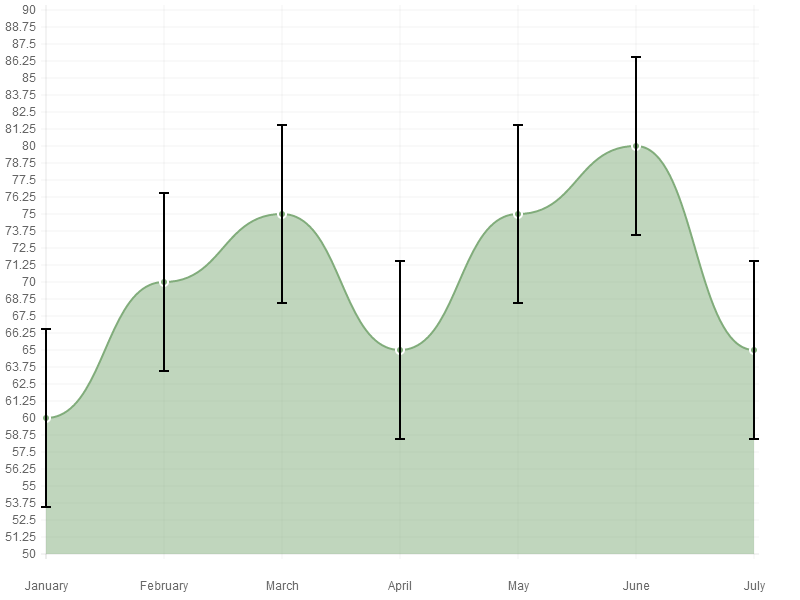
-
deviationStrokeColor(default:rgba(220,220,220,1)) -
deviationWidthwhich is the length of the horizontal lines at the top and bottopm of the vertical line (default: 0px)
var LineData = {
	labels : ["January","February","March","April","May","June","July"],
	datasets : [
		{
			fillColor : "rgba(129, 172, 123, 0.5)",
			strokeColor : "rgba(129, 172, 123, 1)",
			pointColor : "rgba(129, 172, 123, 1)",
			pointStrokeColor : "#fff",
			drawMathDeviation: "stddev",
			deviationStrokeColor: "#000",
			deviationWidth: 5,
			data : [60,70,75,65,75,80,65],
      title : "line 1"
		}
	]
}
 ``` var BarData = { labels : ["January","February","March","April","May","June","July"], datasets : [ { fillColor : "rgba(129, 172, 123, 0.5)", strokeColor : "rgba(129, 172, 123, 1)", pointColor : "rgba(129, 172, 123, 1)", pointStrokeColor : "#fff", drawMathDeviation: "stddev", deviationStrokeColor: "#000", deviationWidth: 5, data : ["60","70","75","65",,"80","0"], title : "bar 1" }, { fillColor : "rgba(29, 72, 223, 0.5)", strokeColor : "rgba(29, 72, 223, 1)", pointColor : "rgba(29, 72, 223, 1)", pointStrokeColor : "#fff", drawMathLine: "mean", mathLineStrokeColor: "#f00", data : [10,20,30,40,50,60,70], title : "bar 2" } ] } ``` It's also possible to draw horizontal lines for the mean or some other math function.
**Important**: It's not possible to draw a math function line which isn't horizontal for example `meanDif`.