900_030_gradientColor.js
Previous Chapter Previous Page Next Page Table of content
gradientColor.js is a small module but .... you will that with ChartNew.js you can realize great things with some few lines.
What is gradient color ? Gradient colored area is a area colored with an non-uniform color.
Example :
-
Include the "Add-ins\gradientColor.js" module.
<SCRIPT src='../Add-ins/gradientcolor.js'></script>
-
In the data part of your chart, specifies "gradientColor" for the fillColor/color and specify a gradientColors variable.
:
var myData = {
labels : (...),
datasets : [
{
fillColor : gradientColor,
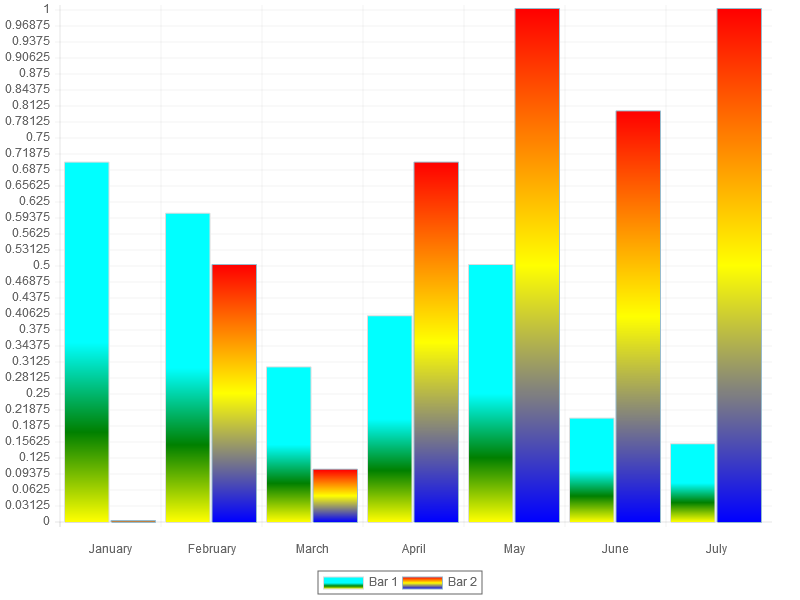
gradientColors : ["#00FFFF 50%","green","yellow"],
(...)
In the gradientColors variable, you have to specify an area of colors; Behind the color you can specify a percentage - This percentage will represent the percent of area the associated to this color.
In the sample ["#00FFFF 50%","green","yellow"], 50 % of the area will be associated to the color "#00FFFF"; The 50 remaining percent of the area will be filled with the remaining colors -> 25% with "green" and 25% with "yellow".
A sample for all chart type can be found in the Sample folder : Sample\issue_102.html"