r scripting charts bar
To use a bar chart you have to import the according classes via:
import(at.gmi.djamei.viz.charts.gral.BarChart)A bar chart has the following parameter options
| Name | Type |
|---|---|
| data | Either a vector or a matrix. If a matrix is passed each row represents a different dataseries. For each column all data series are grouped together under the corresponding group name |
| groups | A character vector containting the names of the columns in the data object |
| colors | A character vector containing the color values to be used for the different data series |
| legend | A character vector representing the text which should be shown for each data series |
| xLabel | The label for the X axis |
| yLabel | The label for the Y axis |
| title | The title of the plot |
| barWidth | Sets the width of each bar as a fraction of the full width. Default: 1.0 |
data <- c(1.0,3.2,6.3)
groups <- c("T1","T2", "T3")
colors <- rainbow(3)
ungrouped_bar <- BarChart$new(data = data,
    barWidth=0.9,
    groups=groups,
    colors = colors,
    legend=groups,
    xLabel = "X",
    yLabel = "Y",
    title = "Simple Bar Chart"
)
phenopipe_add_chart(bar)
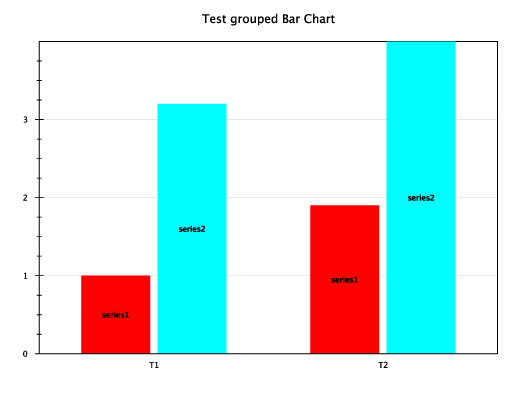
data <- cbind(c(1.0,3.2),c(1.9,4.0))
groups <- c("T1","T2")
colors <- rainbow(2)
grouped_bar <- BarChart$new(data = data,
    barWidth=0.9,
    groups=groups,
    colors = colors,
    legend=c("series1", "series2"),
    xLabel = "X",
    yLabel = "Y",
    title = "Grouped Bar Chart"
)
phenopipe_add_chart(grouped_bar)