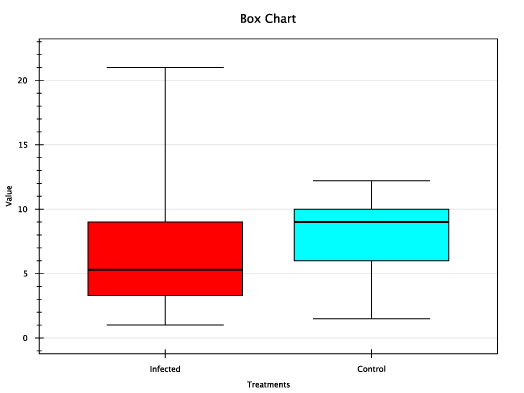
r scripting charts box
To use a box chart you have to import the according classes via:
import(at.gmi.djamei.viz.charts.gral.BoxChart)A box chart has the following parameter options
| Name | Type |
|---|---|
| data | A vector of data values |
| groups | A Factor listing the groupname association of the rows in the data vector |
| colors | A character vector containing the color values to be used for the different groups |
| xLabel | The label for the X axis |
| yLabel | The label for the Y axis |
| title | The title of the plot |
data<- c(1,5.3,21,3.3,9,12.2,1.5,6,9,10)
groups <-c("Infected","Infected","Infected","Infected","Infected","Control","Control","Control","Control","Control")

box <- BoxChart$new(data = data,
groups=factor(groups, levels=unique(groups)),
colors = colors,
xLabel = "Treatments",
yLabel = "Value",
title = "Box Chart")
phenopipe_add_chart(box)