AE Chart_EN
AE Chart is the tab 2 feature of the Network Info Panel, used to bind specific items or fluids from an AE (Applied Energistics) network and visualize amount and rate trends. The dual Y-axis chart simultaneously displays the current stored amount and the real-time change rate, with 8 time windows for viewing trends across different time spans. Brief area text is centered and scalable via the GUI +/- buttons (reusing briefRatio, consistent with the EU Chart).
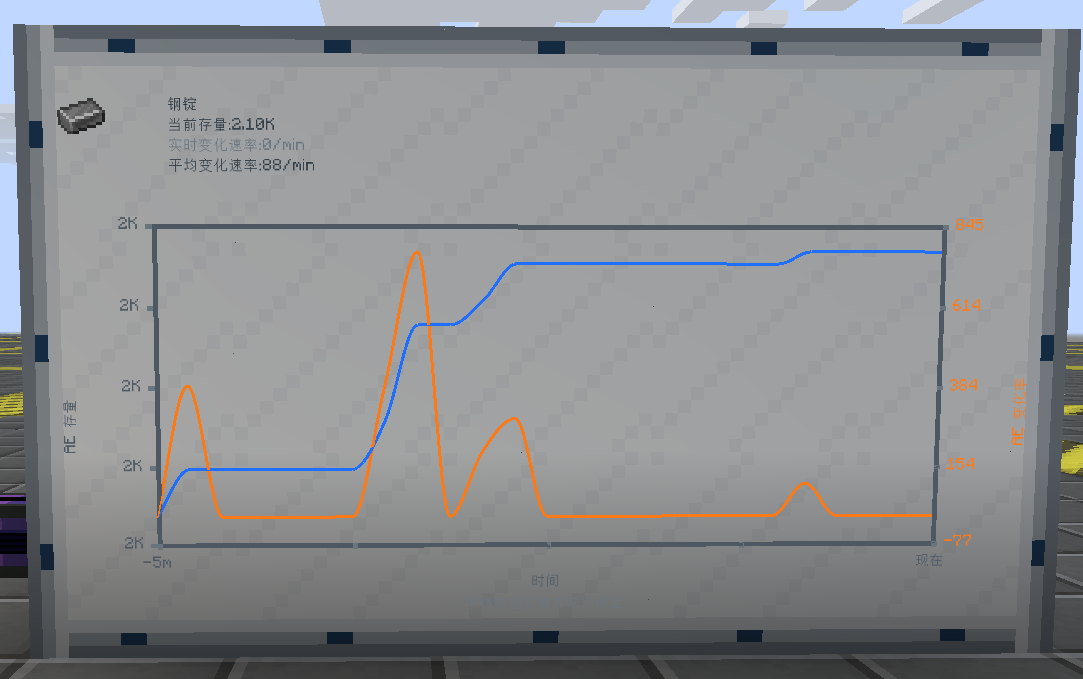
- Bind specific items or fluids from the AE network to visualize amount and rate trends
- Located in Network Info Panel tab 2 (click the "AE Chart" tab to switch)
- Dual Y-axis display: left axis = amount, right axis = rate
- Supports 8 time windows: 5 minutes / 1 hour / 8 hours / 24 hours / 7 days / 1 month (28 d) / 3 months (84 d) / 1 year (336 d), sharing the same natural-ratio inflow chain as the EU Chart
- Brief area is centered, scalable via GUI +/- buttons (reusing
briefRatio, identical mechanism to the EU Chart) - Brief area shows current amount, real-time rate, and average rate
The AE Chart uses a dual Y-axis design to display two types of data simultaneously:
| Axis | Data | Color | Description |
|---|---|---|---|
| Left axis | Amount | Blue 0x1F6FFF | Current stored amount of the item/fluid in the AE network |
| Right axis | Rate | Orange 0xFF7A18 | Same color as the wireless EU network EU/t line; represents change per minute |
Design note: The rate line color (0xFF7A18 orange) matches the EU/t trend line color in the wireless EU network, providing players with consistent color recognition across different tabs.
The AE Chart supports 8 time windows, each a 61-point FIFO (sharing the same natural-ratio inflow chain as the EU Chart; see EU Chart · Inflow Count Chain):
| Window | Points | Sample Interval | Total Duration | Source |
|---|---|---|---|---|
| 5 minutes | 61 | 100 ticks (5 s) | 300 s | Original samples |
| 1 hour | 61 | 1200 ticks (60 s) | 3600 s | Inflow from 5m means |
| 8 hours | 61 | 9600 ticks (480 s) | 28800 s | Inflow from 1h means |
| 24 hours | 61 | 28800 ticks (1440 s) | 86400 s | Inflow from 8h means |
| 7 days | 61 | 201600 ticks (10080 s) | 604800 s | Inflow from 24h means |
| 1 month (28 d) | 61 | 806400 ticks (40320 s) | 2419200 s | Inflow from 7d means |
| 3 months (84 d) | 61 | 2419200 ticks (120960 s) | 7257600 s | Inflow from 1M means |
| 1 year (336 d) | 61 | 9676800 ticks (483840 s) | 29030400 s | Inflow from 3M means |
The 8 time windows are triggered via a nested counter chain with non-uniform ratios, derived naturally from the duration ratio of adjacent windows:
- 5m → 1h: every 12 5m samples triggers 1 1h sample (3600s / 300s = 12)
- 1h → 8h: every 8 1h samples triggers 1 8h sample (28800s / 3600s = 8)
- 8h → 24h: every 3 8h samples triggers 1 24h sample (86400s / 28800s = 3)
- 24h → 7d: every 7 24h samples triggers 1 7d sample (604800s / 86400s = 7)
- 7d → 1M: every 4 7d samples triggers 1 1M sample (2419200s / 604800s = 4, 1M=28d)
- 1M → 3M: every 3 1M samples triggers 1 3M sample (7257600s / 2419200s = 3, 3M=84d)
- 3M → 1Y: every 4 3M samples triggers 1 1Y sample (29030400s / 7257600s = 4, 1Y=336d≈11 months)
The counter chain ratio is 12 → 8 → 3 → 7 → 4 → 3 → 4 (5m → 1h → 8h → 24h → 7d → 1M → 3M → 1Y).
Natural Ratio Meaning: Same as the EU Chart. The "inflow trigger count" of each window equals the duration ratio of adjacent windows. All windows are 61-point FIFOs that drop oldest when full. The AE mean field is
rate(change rate), which takes the mean on inflow;amountandtimeMstake the snapshot value.
The brief area displays the following 3 key data points:
| Data Item | Calculation | Description |
|---|---|---|
| Current amount | Real-time read | Real-time stored amount of the item/fluid in the AE network |
| Real-time rate | Real-time calculation | Current change per minute (/min) |
| Average rate | First-last difference method | Computed from the first and last points of the current 61-point window (/min) |
First-last difference method: Average rate = (last amount - first amount) / time span, computed from the 61-point FIFO window, smoothing short-term fluctuations to reflect overall trends.
Bind items or fluids from the AE network by right-clicking the info panel:
- Right-click with item in hand: binds that item as the chart monitor target
- Right-click with fluid container in hand: binds that fluid as the chart monitor target
- Right-click again with empty hand: clears the current binding
Binding message: On successful binding, displays
已绑定走势图物品/流体:%s(%s = item/fluid name).
All configuration items of the AE Chart (with defaults and ranges):
| Config Item | Type / Default | Range | Description |
|---|---|---|---|
| aeTrackingWindow | int | 0-7 | AE time window (0=5m / 1=1h / 2=8h / 3=24h / 4=7d / 5=1M / 6=3M / 7=1Y) |
| aeChartBorderThickness | int = 3 | - | AE chart border thickness |
| aeChartBackgroundColor | String = "" | - | AE chart background color (empty = no fill) |
| aeTrendLineThickness | int = 3 | - | AE trend line width |
| aeTrendLineSmoothing | int = 2 | 0-12 | AE spline smoothing |
| aeAxisMin | String | - | AE Y-axis minimum (empty = auto) |
| aeAxisMax | String | - | AE Y-axis maximum (empty = auto) |
| aeLineColor | String = "1F6FFF" | - | AE trend line color (default blue) |
| showAEBrief | boolean = true | - | AE brief toggle |
| showAEChartAmount | boolean = true | - | AE amount curve toggle |
| showAEChartRate | boolean = true | - | AE rate curve toggle |
| briefRatio | int = 28 | 10-80 | Reused by AE Chart from v1.5.17: brief font ratio (shared with EU Chart), adjusted via GUI +/- buttons, scale = briefRatio/20.0 |
GUI Button Mapping (from v1.5.17): The window-label button on the AE Chart tab (showing the current window name) now switches the 8 time windows on click (consistent with the EU Chart), while the +/- buttons are used to adjust the brief font size (modifying
briefRatio). Previously the +/- buttons switched windows; they have been remapped for consistency with the EU Chart.
- Step 1: Craft a Network Info Panel and place it in the world
- Step 2: Open the GUI and click the "AE Chart" tab (tab 2)
- Step 3: Hold an item/fluid container from the AE network and right-click the panel to bind
- Step 4: Configure Y-axis range, line width, smoothing, color, etc. in the GUI
- Step 5: Click the window-label button to switch the 8 time windows (5m / 1h / 8h / 24h / 7d / 1M / 3M / 1Y); use +/- buttons to adjust the brief font size
- Step 6: View the dual Y-axis chart and centered brief area data; observe trends across different spans
Color constants used by the AE Chart:
| Element | Color Value | Color | Description |
|---|---|---|---|
| Amount line | 0x1F6FFF | Blue | Left axis amount trend line |
| Rate line | 0xFF7A18 | Orange | Right axis rate trend line; same color as EU/t line |
| Axis | 0x4E5964 | Dark gray | Chart axis lines |
| Tick marks | 0x6A7680 | Gray | Axis tick labels |