Wireless Energy Monitor_EN
The Wireless Energy Monitor is an LV-tier single-block machine that displays the wireless grid energy status in real time (sampled every 5 seconds). It is a pure information device that neither consumes nor produces energy, used only for grid monitoring and redstone logic output.

- Tier: LV (Tier 1, casing texture MACHINE_CASINGS[1])
- Pure information device: does not consume or produce energy
- Real-time display of grid energy, average EU/t, realtime EU/t
- Advanced redstone control (5 modes + 3 anchor modes)
- Supports Nuclear Control 2 Industrial Info Panel connection
- Dynamic front texture: overlays ON/OFF texture based on redstone output
- Inventory disabled: pure display device, no item interaction
Craft the Wireless Energy Monitor in a crafting table using this 3×3 matrix:
| Slot | Col 1 | Col 2 | Col 3 |
|---|---|---|---|
| Row 1 | LV Receiver | Steel Plate | LV Receiver |
| Row 2 | LV Receiver | LV Machine Hull | LV Receiver |
| Row 3 | Steel Screw | Steel Plate | Steel Screw |
| Material | Count | Source |
|---|---|---|
| LV Receiver (Sensor_LV) | 4 | GT crafting table |
| Steel Plate (plateSteel) | 2 | GT plate forming |
| LV Machine Hull (Hull_LV) | 1 | GT crafting table |
| Steel Screw (screwSteel) | 2 | GT screw forming |
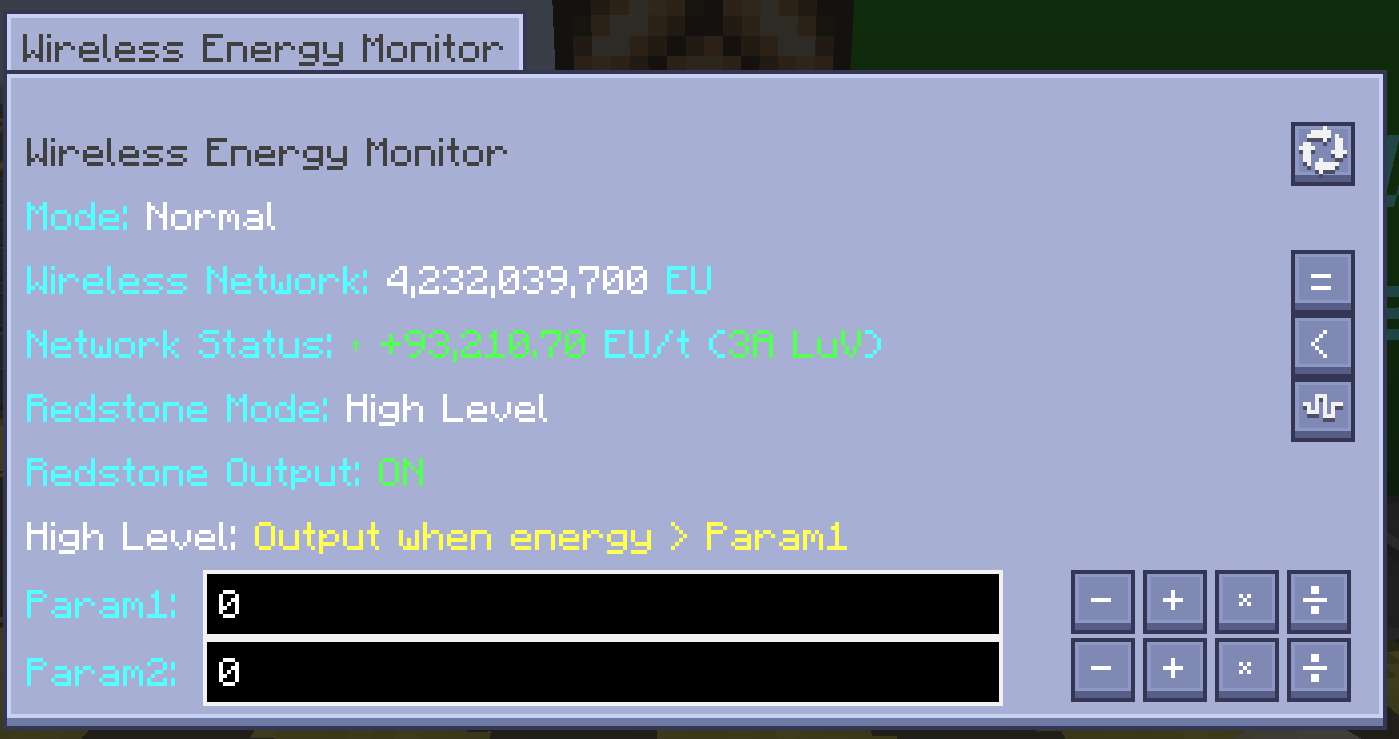
GUI size: 346 × 181 pixels. The GUI is built on ModularUI 2 with a Flow column layout, totaling 10 rows (including the title row) from top to bottom:
| Row | Content | Widget Type |
|---|---|---|
| 1 | Title row (display mode switch button) | Text + ButtonWidget |
| 2 | Mode text (current display mode description) | Plain text |
| 3 | Grid capacity + anchor mode 1 switch button | Text + ButtonWidget |
| 4 | Grid status + anchor mode 2 switch button | Text + ButtonWidget |
| 5 | Realtime grid status + anchor mode 3 switch button | Text + ButtonWidget |
| 6 | Redstone mode + switch button | Text + ButtonWidget |
| 7 | Redstone output status | Plain text |
| 8 | Redstone mode description | Plain text |
| 9 | Parameter 1 input + 4 adjustment buttons | ScientificTextFieldWidget + 4 ButtonWidget |
| 10 | Parameter 2 input + 4 adjustment buttons | ScientificTextFieldWidget + 4 ButtonWidget |
Parameter 1 / Parameter 2 input boxes are 200 × 17 pixels, using ScientificTextFieldWidget (extends TextFieldWidget). In scientific mode the content is auto-formatted to 1.5E6 on focus loss; users may type scientific strings like 1E6 or 1.5E5 (parsed by EvalEx) or plain numbers (auto-converted on focus loss). The actual value is stored as long in LongSyncValue; scientific notation is for display only.
Each parameter row has 4 adjustment buttons on the right, with dynamic step based on the highest digit:
| Button | Symbol | Behavior |
|---|---|---|
| Decrement highest digit | - | Subtract 1 from the highest digit |
| Increment highest digit | + | Add 1 to the highest digit |
| Multiply by 10 | × | Parameter ×10 |
| Divide by 10 | ÷ | Parameter ÷10 |
The monitor supports 3 display modes, switched via the GUI title button:
| Mode | Name | Example |
|---|---|---|
| 0 | Normal counting | 1,234,567 EU |
| 1 | Scientific notation | 1.23×10^6 EU |
| 2 | Metric notation | 1.23M EU |
Precision difference:
ScientificTextFieldWidgetuses 3 decimals (%.3f, e.g. 1.234×10^6) for input box internal formatting (higher precision for editing);FormatUtil.formatScientificuses 2 decimals (%.2f, e.g. 1.23×10^6) for GUI display text.
The anchor mode determines which value the redstone logic is based on. Switch via the 3 buttons in the GUI (grid capacity / grid status / realtime grid status rows). setAnchorMode clamps to [0, 2]:
| Mode | Anchor Target | Type | Source |
|---|---|---|---|
| 0 | Grid Energy | BigInteger |
WirelessNetworkManager.getUserEU(UUID) direct read |
| 1 | Average EU/t | double → long |
Math.round(euPerTick) (300s window first-last slope) |
| 2 | Realtime EU/t | double → long |
Math.round(realtimeEuPerTick) (last 2 samples slope) |
Note: Redstone logic is based on the anchor value. Switching anchor mode lets redstone use grid energy or EU/t status as the metric, suitable for different scenarios (e.g. "alert when energy drops below threshold" vs "alert when EU/t is long-term negative").
The monitor supports 5 redstone output modes, switched via the GUI redstone mode button. Output strength is 15 (full) or 0, with a check interval of 2 ticks (0.1 s) using an independent timestamp lastRedstoneCheckTick for fast response.
| Mode | Name | Behavior |
|---|---|---|
| 0 | Off | No redstone output |
| 1 | High | Output 15 when anchor > param 1 |
| 2 | Low | Output 15 when anchor < param 1 |
| 3 | High-Hysteresis | Output 15 when anchor > param 1; cancel only when anchor < param 2 |
| 4 | Low-Hysteresis | Output 15 when anchor < param 2; cancel only when anchor > param 1 |
- Parameter 1 / Parameter 2 may be negative
- Output via
getGeneralRS(ForgeDirection);allowGeneralRedstoneOutputreturns true - On state change, calls
setOutputRedstoneSignalto update 6 faces +notifyBlocksOfNeighborChange - Hysteresis modes (3/4) share a single state machine:
getGeneralRSandupdateRedstoneOutputuse the same logic
| Parameter | Value | Description |
|---|---|---|
| Sample interval | 100 ticks (5 s) | UI display & EU/t calculation frequency |
| Window length | 300 seconds | 61-point FIFO (1 initial + 60 interval checks) |
| Redstone check interval | 2 ticks (0.1 s) | Independent timestamp for fast response |
| Reload delay | 600 ticks (30 s) | Redstone buffer period after long reload |
| BigDecimal precision | 6 decimals, HALF_UP | Exact division for EU/t slope |
| Dataset capacity | 61 | EUDataSet.CAPACITY constant |
| Long-term silent threshold | 6000 ticks (300 s) | LONG_SILENT_THRESHOLD_TICKS |
The grid status display uses four branches (shared with the portable HUD):
| Condition | Text | Color |
|---|---|---|
| dataSet.size() < 2 | No change / Calculating | Default |
| eut == 0 (first & last EU identical) | 0 EU/t (Silent) | Gray §7 |
| 0 < | eut | < 1 |
| eut | >= 1 |
When the grid stays silent (all sampled values identical) for ≥ 300 seconds:
- Status label switches from "Silent" to "Long-Term Silent" (color becomes dark gray §8)
- Dataset compacted to 2 data points (first & last), saving memory
-
longTermSilentNBT flag persisted - On next sample, if the value differs, the last point is kept as the new starting point (size=2, eut immediately calculable)
When redstoneReloadDelay > 0 (the 30-second redstone buffer period after a long reload), the grid status shows "Reload Calculating - Redstone Logic Maintained" (red §c), with priority over normal calculation. During this period, redstone logic is held unchanged to avoid accidental switching.
The monitor calculates two EU/t values simultaneously:
| Type | Method | Sample Range | Characteristic |
|---|---|---|---|
| Average EU/t | EUDataSet.calculateEUT() |
First & last points (300s window) | Long-term trend, stable |
| Realtime EU/t | EUDataSet.calculateRecentEUT() |
Last 2 samples (5s) | Instant change, sensitive |
Both use the slope formula (newest.value - oldest.value) / (newest.tick - oldest.tick), with BigDecimal exact division (6 decimals, HALF_UP) to avoid precision loss when converting BigInteger to double for large EU values.
EU/t is converted to a GT-style power tier display in the format XA TIER, e.g. 2A HV (2 amperes High Voltage). The system auto-upshifts to keep amperage ≤ 4A:
ULV(8) / LV(32) / MV(128) / HV(512) / EV(2048) / IV(8192) /
LuV(32768) / ZPM(131072) / UV(524288) / UHV(2097152) / ... / MAX(2147483647)
MTEWirelessEnergyMonitor implements Nuclear Control 2's IMetricsExporter interface, allowing it to serve as an info source for NC2 sensor cards:
-
getInfoData(): returns 4 pieces of info:
- Title (monitor name)
- Current energy (grid capacity)
- Average EU/t status
- Realtime EU/t status
- reportMetrics(): supports cross-dimensional monitoring; NC2 info panels can read monitor data remotely
- Can serve as an info source for NC2 Industrial Info Panel sensor cards
The monitor uses different strategies for short and long reloads to ensure redstone output and data continuity:
- Dataset preserved, calculation resumes directly
- Slope error ≤ 3.3% (acceptable)
- No redstone buffer
- Dataset cleared, cold start triggered
- Enables 30-second redstone buffer (
redstoneReloadDelay = 600 ticks) to maintain redstone output - During the delay, skips
updateRedstoneOutput, relies onmSidedRedstone[]persistence to output cached signal - After the delay, normal calculation and redstone logic resume
Gap detection: At the start of onPostTick (before the
dataSet.isEmpty()short-circuit):lastCheckTick > 0 && gap > 200L(>10 s) triggers the long-reload branch.
All key monitor state is persisted to NBT and restored on rejoin:
| Key | Type | Meaning |
|---|---|---|
| displayMode | int | Display mode (0=Normal, 1=Scientific, 2=Metric) |
| ownerUUID | String | Owner player UUID |
| euPerTick | double | Average EU/t calculation state |
| measurementHistory | Compound | Measurement history (EUDataSet serialized, count + m{i}(tick + value) + longTermSilent) |
| redstoneMode | int | Redstone mode (0-4) |
| anchorMode | int | Anchor mode (0=Grid Energy, 1=Average EU/t, 2=Realtime EU/t) |
| param1Value | String | Parameter 1 (BigInteger string) |
| param2Value | String | Parameter 2 (BigInteger string) |
| redstoneOutput | boolean | Redstone output state |
| lastRedstoneCheckTick | long | Redstone check timestamp |
| lastCheckTick | long | UI / EU/t check timestamp |
| realtimeEuPerTick | double | Realtime EU/t calculation state |
| longTermSilent | byte | Long-term silent flag (inside measurementHistory Compound) |
Load behavior: On load,
redstoneOutputis recalculated based on current grid energy and parameters (using hysteresis logic: treated as non-output state on load, firstupdateRedstoneOutputrecalculates), andissueTextureUpdateis triggered to refresh the texture.