Repository navigation
Lineage Graph
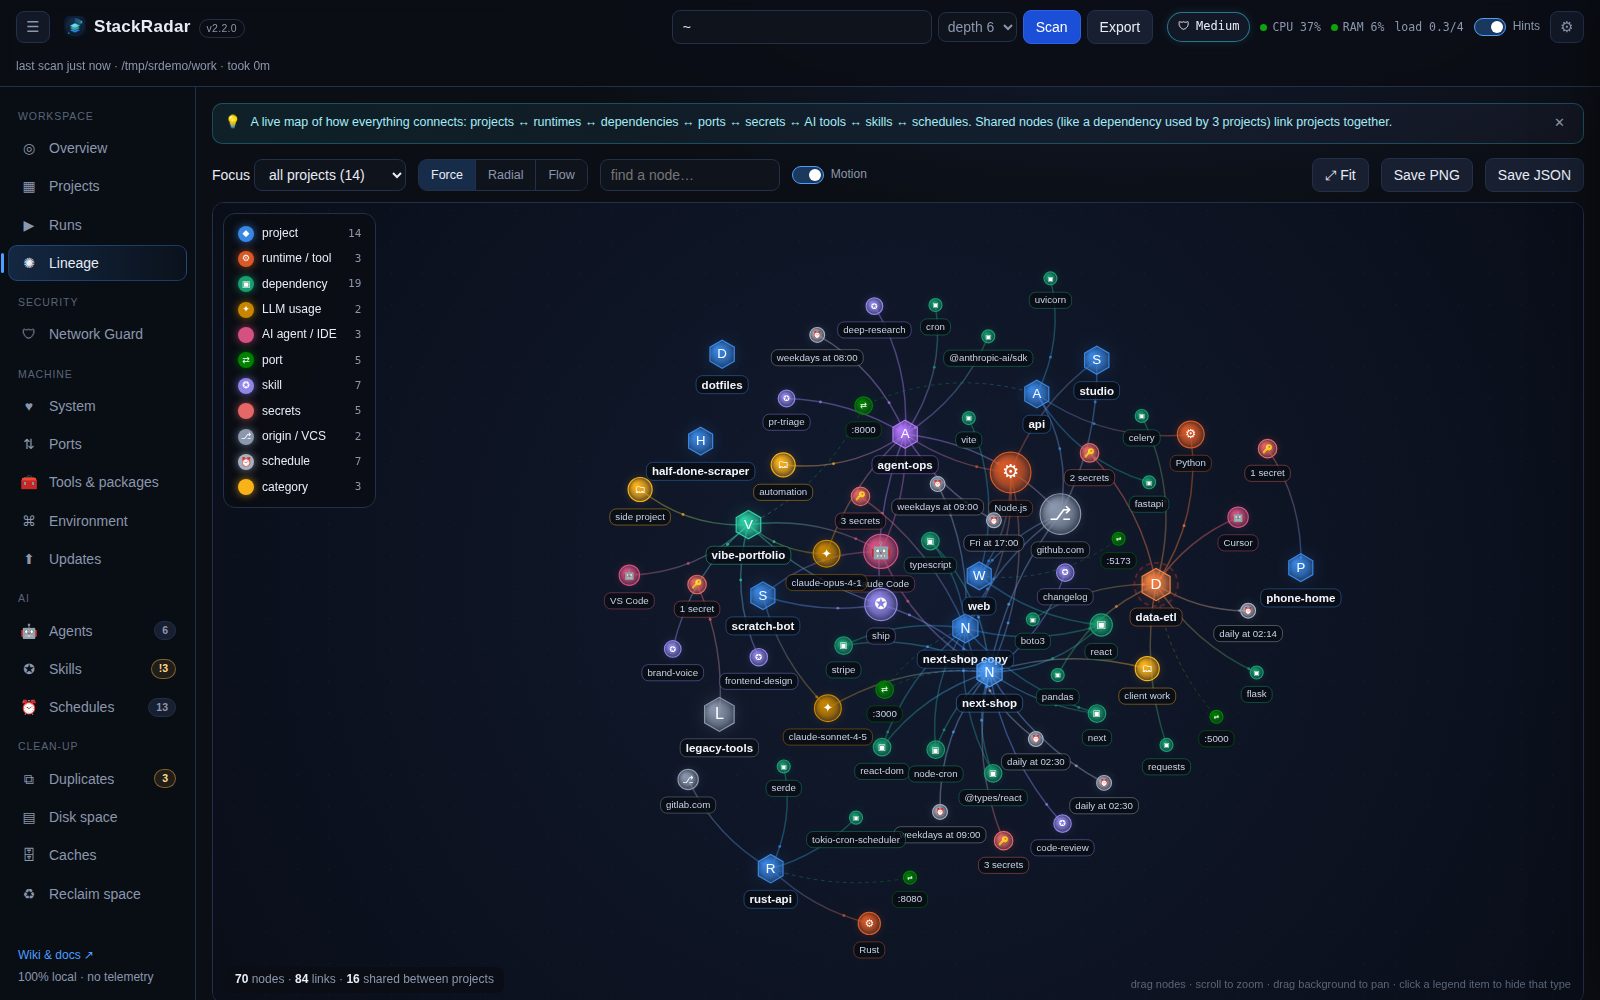
The lineage graph draws everything StackRadar knows as one network. A node shared by several projects (the same dependency, runtime, git host, agent or skill) links those projects together, so you can see your stack at a glance.
| Icon | Type | Comes from |
|---|---|---|
| ◆ (hexagon) | project | every scanned project. Size scales with disk use, colour = your tag |
| ⚙ | runtime / tool | Node.js, Python, Rust, Go, Ruby, Docker … |
| ▣ | dependency |
package.json, requirements*.txt, pyproject.toml, Cargo.toml
|
| ✦ | LLM usage | models found in Claude Code session logs |
| 🤖 | AI agent / IDE | marker folders (.claude, .cursor, .vscode …) |
| ⇄ | port | open now (pulsing ring) or expected (dashed link) |
| ✪ | skill | skills used while working in that project |
| 🔑 | secrets | count of masked secrets |
| ⎇ | origin / VCS | git host (github.com, gitlab.com …) |
| ⏰ | schedule | cron / timers found in the project |
Projects that are running get a pulsing green halo; high-risk projects get a dashed red halo. The eight categorical colours are validated for colour-blind separation and contrast on the dark canvas. Every node also carries an icon and a label, so colour is never the only cue.
| Layout | Best for |
|---|---|
| Force | organic clusters; shared dependencies float between their projects |
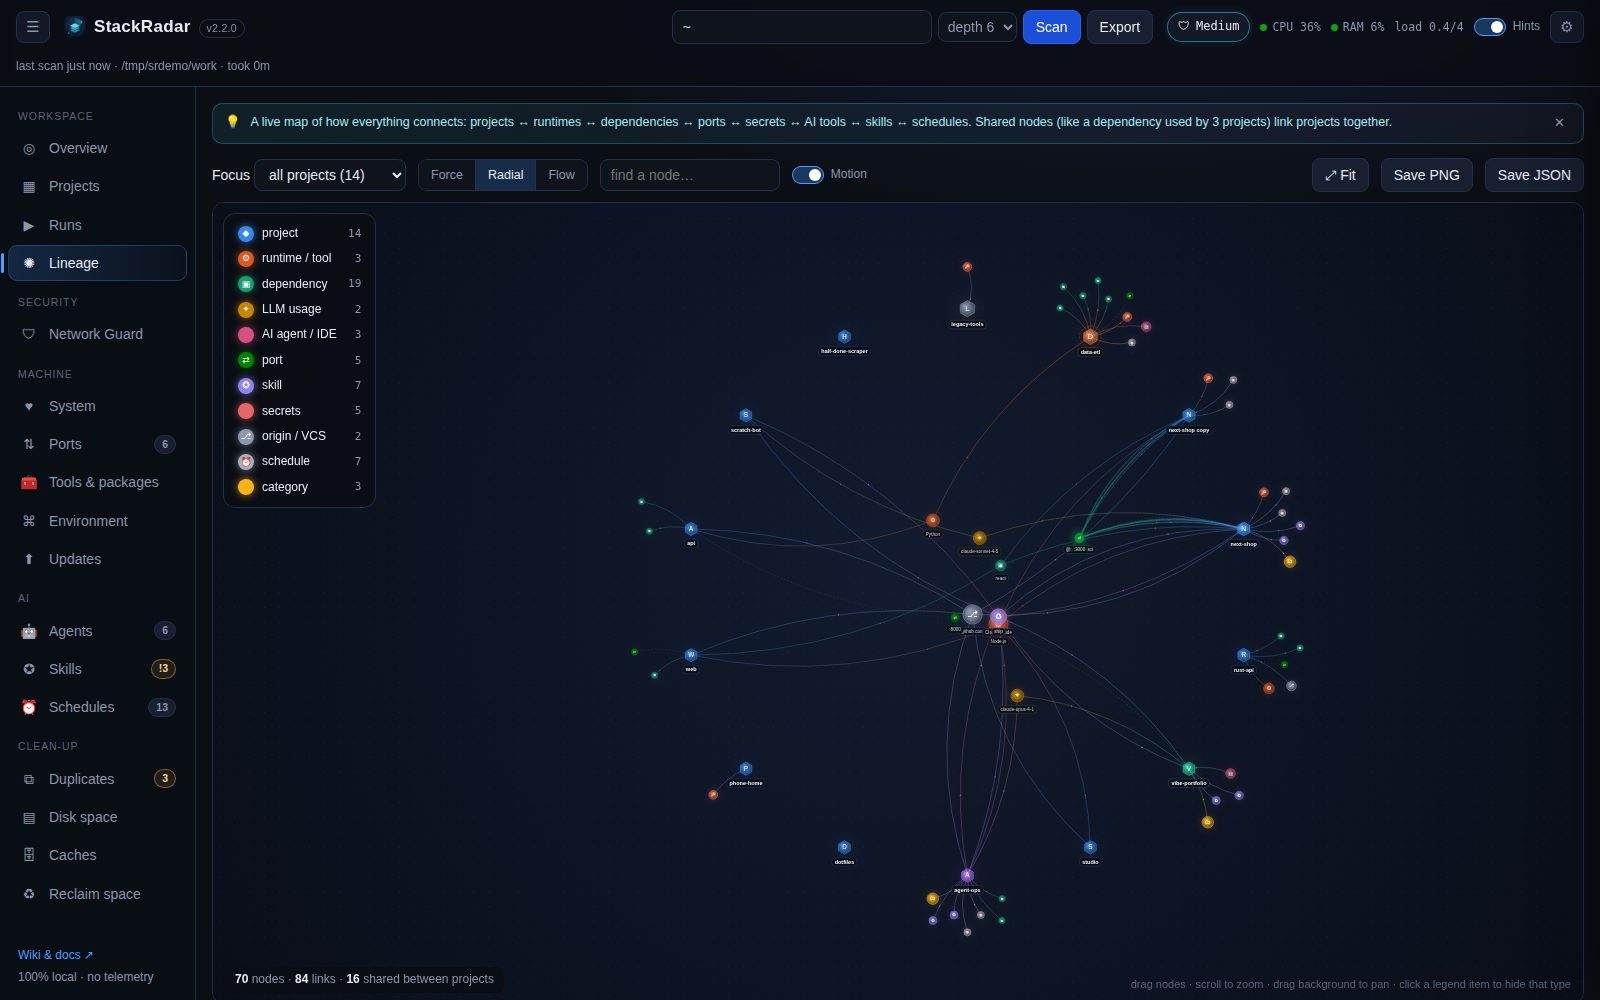
| Radial | projects on a ring, private attributes orbit their project, shared nodes pulled to the centre |
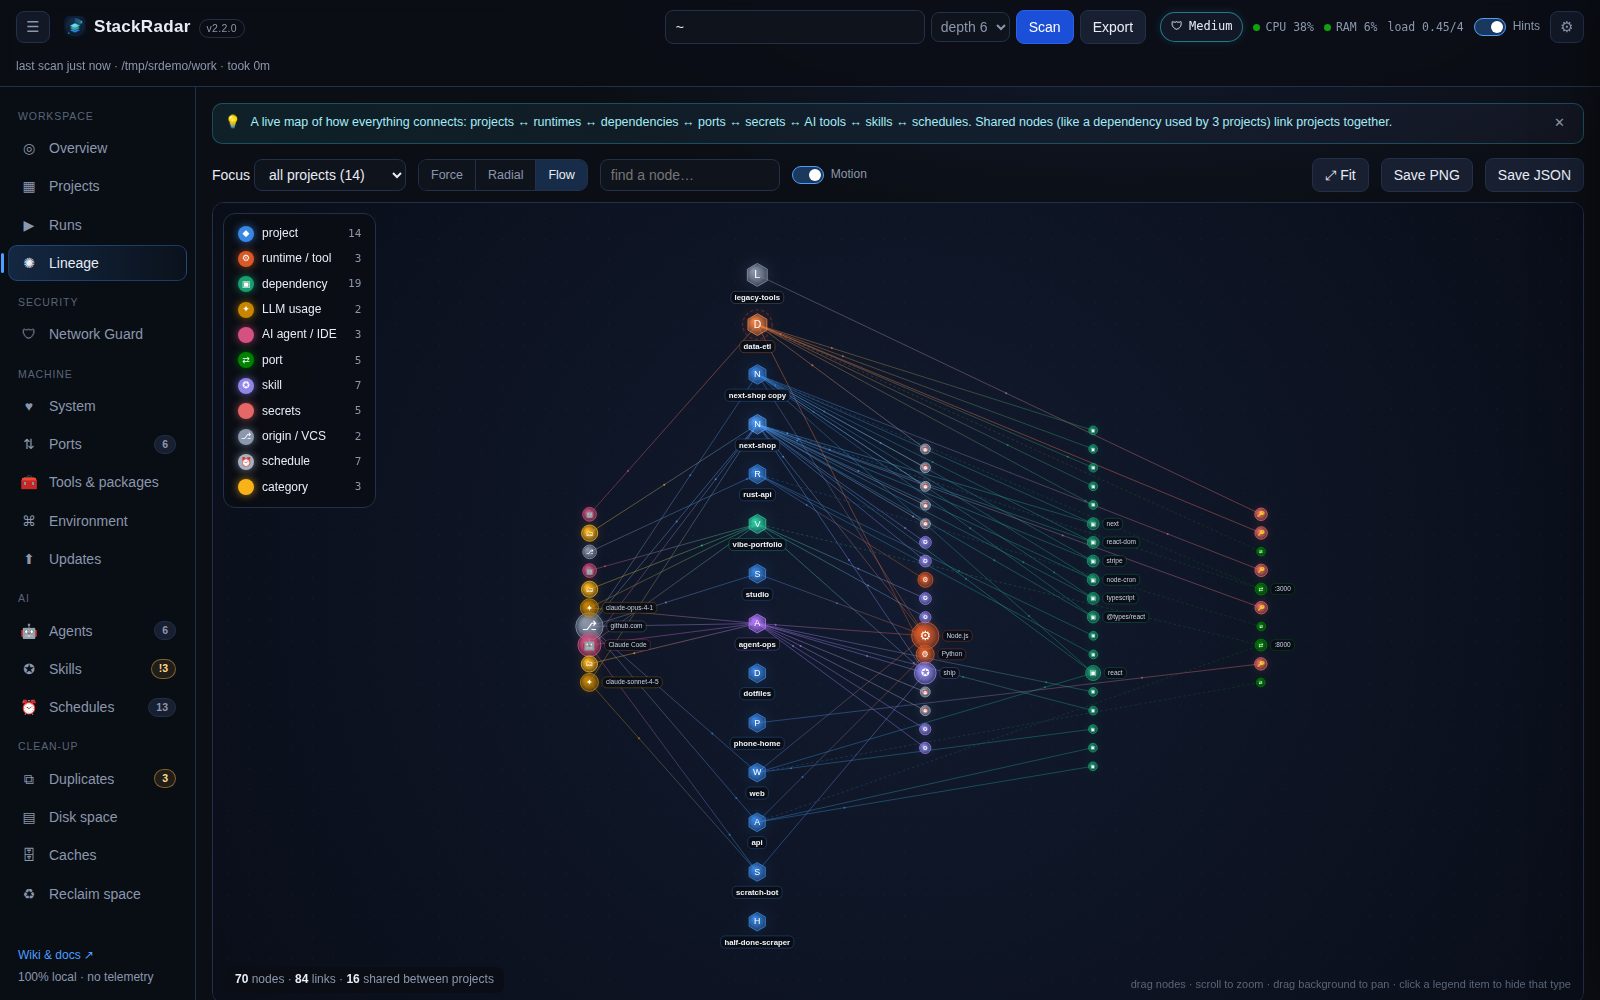
| Flow | left → right lineage: origin & agents → project → runtime / skills / schedules → dependencies → ports & secrets |
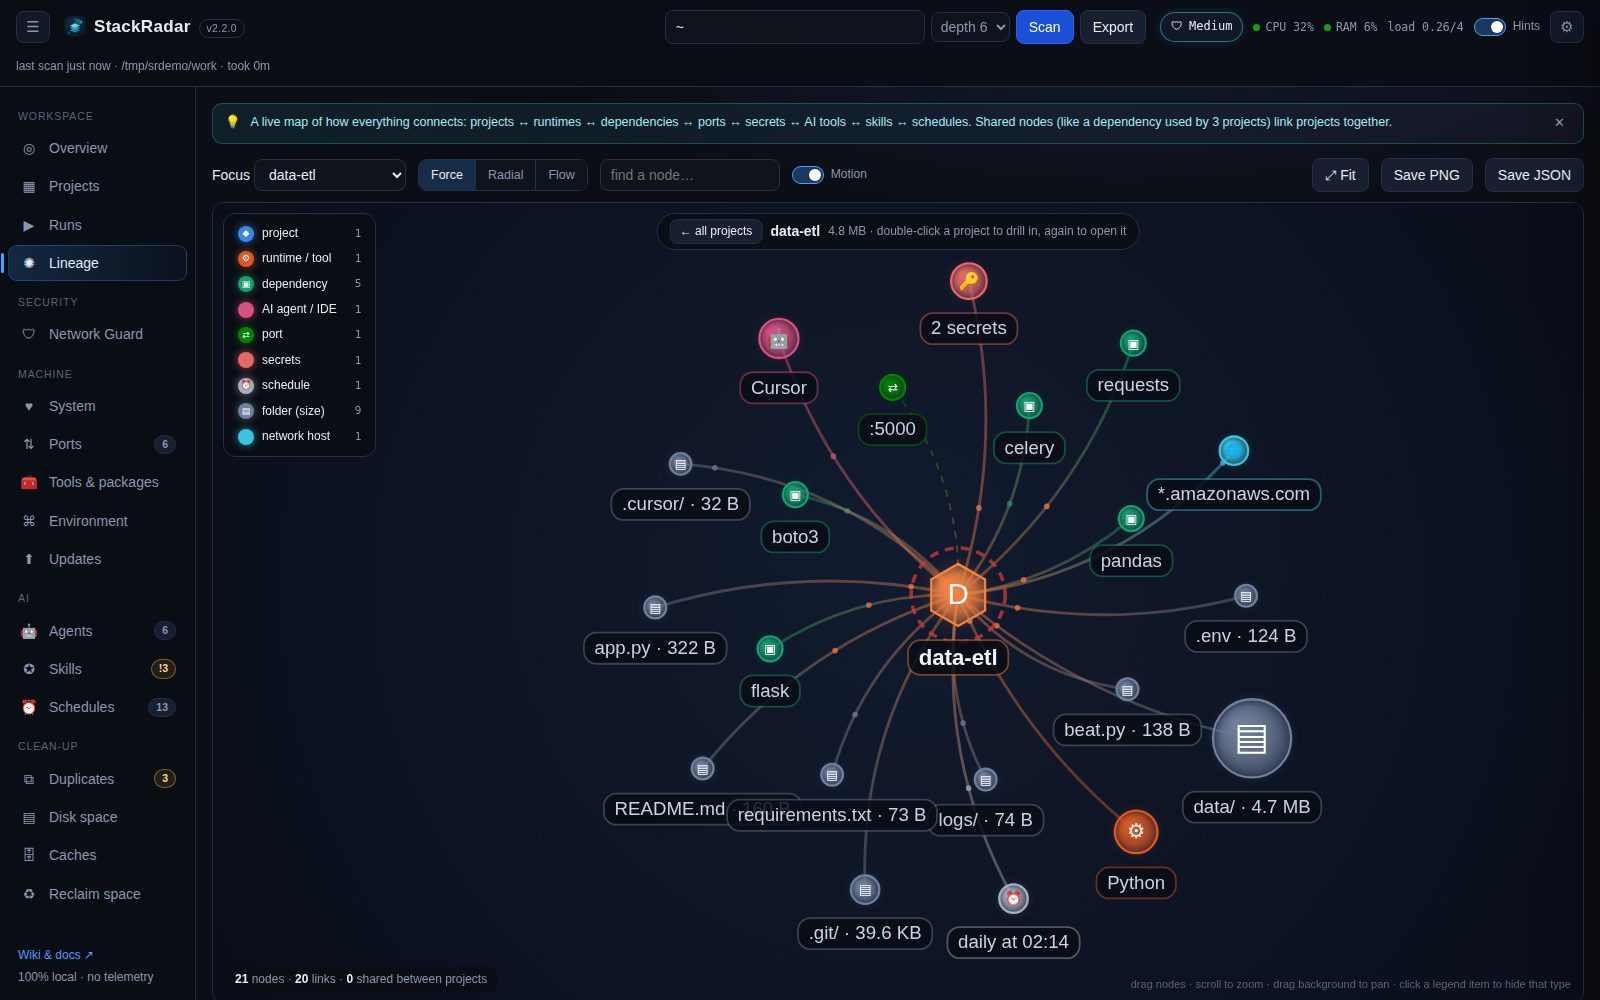
Double-click a project (or 🔍 Drill in in its info panel, or pick it in Focus) to see just that project with: its folders sized (bigger circle = more space; click one for ▤ open in Disk space), the projects inside it or around it, the network hosts its code talks to, and the agents that worked on it (with session and token counts). ← all projects goes back; double-click the project again to open its details. In the all-projects view, your categories appear as nodes that group their projects.
- Hover a node: tooltip, and its neighbourhood lights up while everything else dims.
- Click a node: details panel with connected-node chips (click a chip to jump there). Double-click a project to open its drawer.
- Drag nodes, scroll to zoom, drag the background to pan, ⤢ Fit to frame everything.
- Legend items are toggles: hide dependencies to see just projects + agents, for example.
- Find a node… highlights matches and flies the camera to the first one.
- Motion switch: animated particles flowing along the links (turn off on slow machines).
- Focus: one project only (shows more of its dependencies, skills and schedules).
- Save PNG (2× resolution with a timestamp) or Save JSON (nodes + edges for your own tooling).