Repository navigation
System Monitor
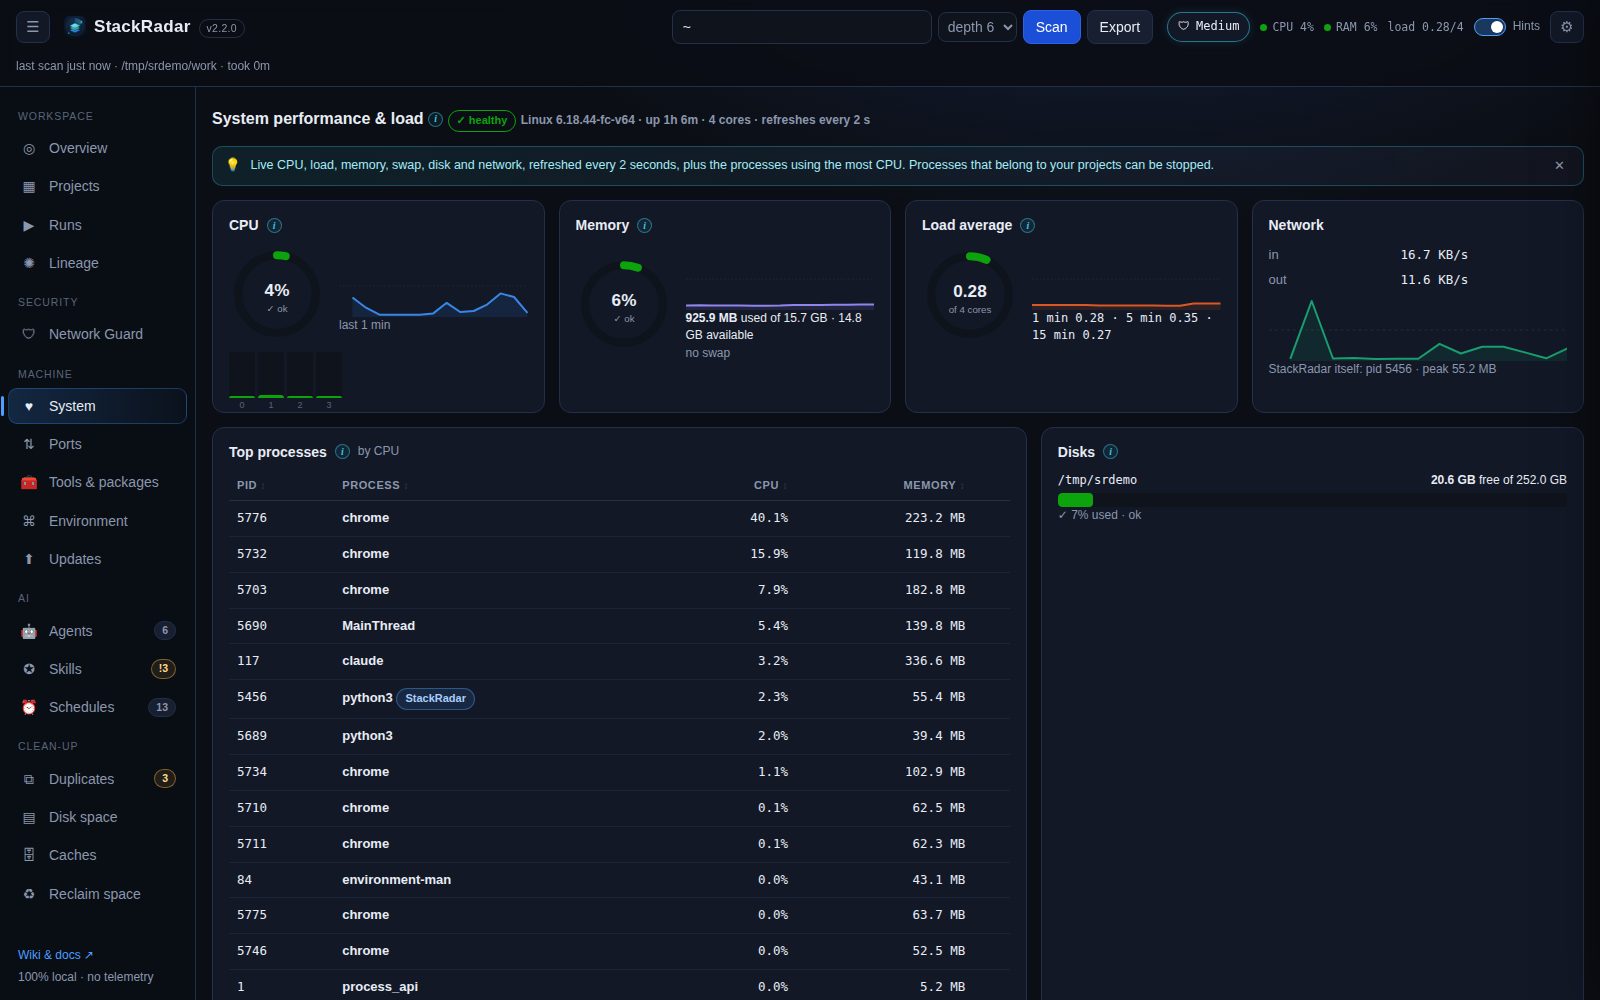
A live view of the machine, sampled every 2 seconds in the background (the last 5 minutes are kept for the sparklines).
| Panel | What it shows | Source |
|---|---|---|
| CPU | total %, per-core bars, sparkline |
/proc/stat (Linux), top (macOS), GetSystemTimes (Windows) |
| Memory | used / available / total, swap |
/proc/meminfo, vm_stat + sysctl, GlobalMemoryStatusEx
|
| Load average | 1 / 5 / 15 min vs. core count |
os.getloadavg() (not available on Windows) |
| Network | in / out bytes per second |
/proc/net/dev (Linux) |
| Disks | free space for home, scan roots and /
|
shutil.disk_usage |
| Top processes | heaviest by CPU, with memory |
ps / PowerShell Get-Process
|
A status badge (✓ healthy / ● busy / ▲ under pressure) sums things up. It turns busy above 60% CPU, 75% memory or load above the core count, and under pressure above 85% / 90% / 1.5× cores. Status colours always come with an icon and a word, never colour alone.
Processes whose working directory is inside a scanned project (or that StackRadar started) are tagged 📦 project and get a stop button. Everything else is read-only. The top bar shows a mini CPU / RAM / load meter on every tab. Click it to open System. Hover a sparkline for the exact value at that moment.