Repository navigation
Process maps
A map shows a process over two variables at once. extensions/chemistry/maps.mojo scans constraints over temperature and pressure, and draws Ellingham diagrams and predominance maps from the data.
This page is a reference. For the rest of the library, see Process chemistry.
scan evaluates a list of constraints on a grid. The temperature is on a linear scale, and the pressure is on a logarithmic scale. A Grid gives holds(column, row) and share(), the part of the nodes where every constraint holds.
boundary traces the edge of that region by marching squares. Each Segment joins two points of temperature and pressure. A side of a grid has 2 to MAX_SIDE nodes.
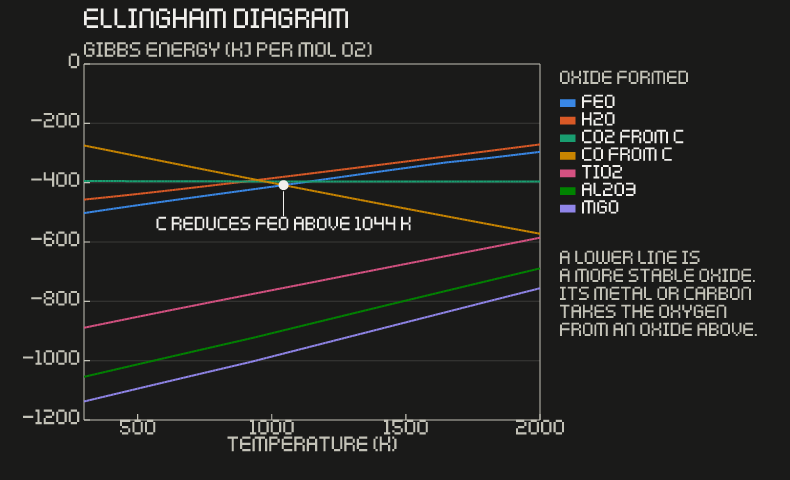
ellingham(reaction, temperature) gives the standard Gibbs energy change of an oxidation per mole of O2. The reaction must have O2 gas as a reactant, such as 2 Fe + O2 = 2 FeO.
-
oxygen_pressureis the O2 pressure in balance with the oxidation. Below it, the oxide gives up its oxygen. -
reducing_ratiois the CO/CO2 or H2/H2O ratio in balance with it, through a couple such as 2 CO + O2 = 2 CO2. -
ellingham_crossingfinds where two lines cross by bisection.
A lower line is a more stable oxide. Its metal, or carbon where the carbon line is lower, can take the oxygen from an oxide above it. The figure shows that carbon reduces FeO above 1044 K in this data.
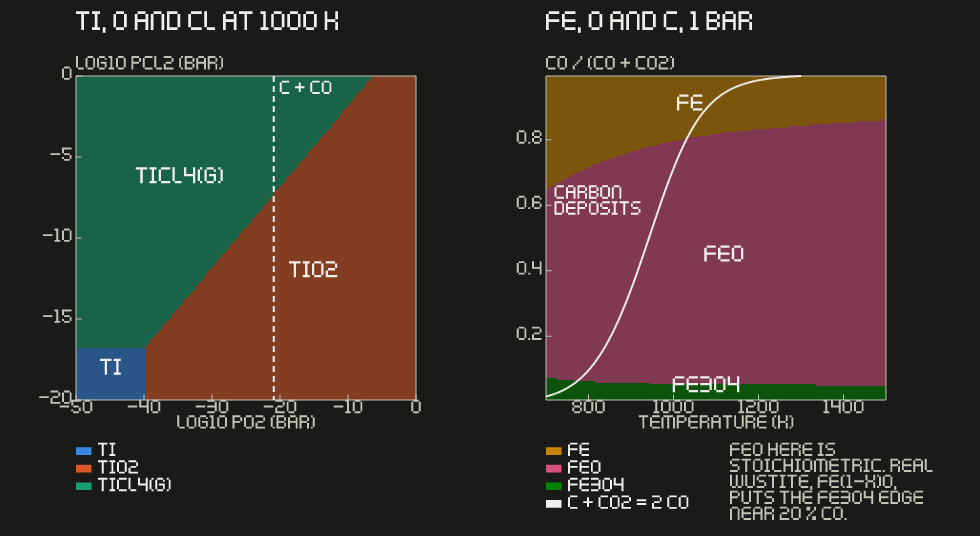
predominance labels each point of a plane of two gas pressures with the most stable compound of a base element. This is a Kellogg diagram. The axes are log10 of each pressure in bar.
oxide_map labels each point of a plane of temperature and the fraction of a reducing gas. This is the Baur-Glaessner diagram of iron. The gas is a reducing gas and its oxidized form, such as CO and CO2.
Both maps compare the candidates per atom of the base element, with the gases at the pressures of the point. A condensed candidate is pure. A gaseous candidate of the base element is at a fixed partial pressure, one bar by default.
The left map shows why the chlorinator burns carbon with the ore. Rutile turns into TiCl4 only where the O2 pressure is very low. Carbon and CO at one bar hold the O2 pressure near 1e-21 bar, the dashed line.
examples/ellingham.mojo and examples/predominance.mojo draw these figures with the Axes of Crystals and figures:
make out/ellingham.png out/predominance.pngThe FeO in the NASA data is stoichiometric, and real wustite is Fe(1-x)O. That moves the iron map's edges. The Fe/FeO edge comes out near 80 % CO, where the handbook gives about 70 %. The Fe3O4/FeO edge comes out near 3 % CO, where the handbook gives about 20 % at 1000 degC. In this data, wustite is stable from about 430 K, where the real value is 843 K.
Use the iron map to see the method, not to set a furnace gas.