Vizualizing Data in ParaView
ParaView sees the VizWall coordinate system in units of meters. Since the VizWall is around 5m wide it is recommended that you scale your data to lie within a cube, centered at (0,0,0) and extending from (-2.5,-2.5,-2.5) to (+2.5,+2.5,+2.5). You can do this either by scaling your data before importing to ParaView, or by using the Transform filter in ParaView to scale/shift your data.
You should also inform ParaView of the position of the camera. This can be adjusted using the "Adjust camera" icon ( ). Recommended settings are:
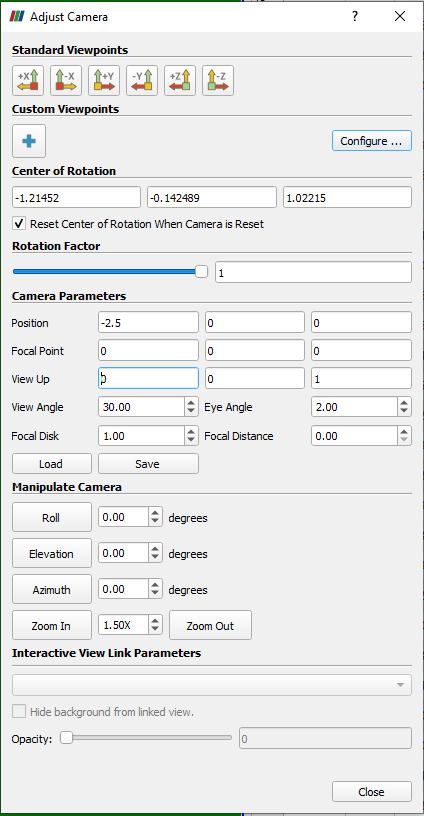
The key setting here is the "Position". This should place you data approximately in the plane of the screen.
It can be useful to start from a simple state showing some geometrical objects so that you can easily check if things are set up correctly. To do this, from the "File" menu, select "Load state", and load the "geometry.pvsm" file. This display a green unit cube centered at (0,0,0), with an embedded purple plane. If things are set up correctly then the green cube should fill approximately one screen width on the VizLab, be centered horizontally, and be at approximately eye height. If you walk left and right the cube should not move on the screen, but you will be able to see the left and right sides of it. Similarly, if you move your head down toward the floor you should be able to see under the plane and eventually see the underside of the cube.