Heat Map Visualiser
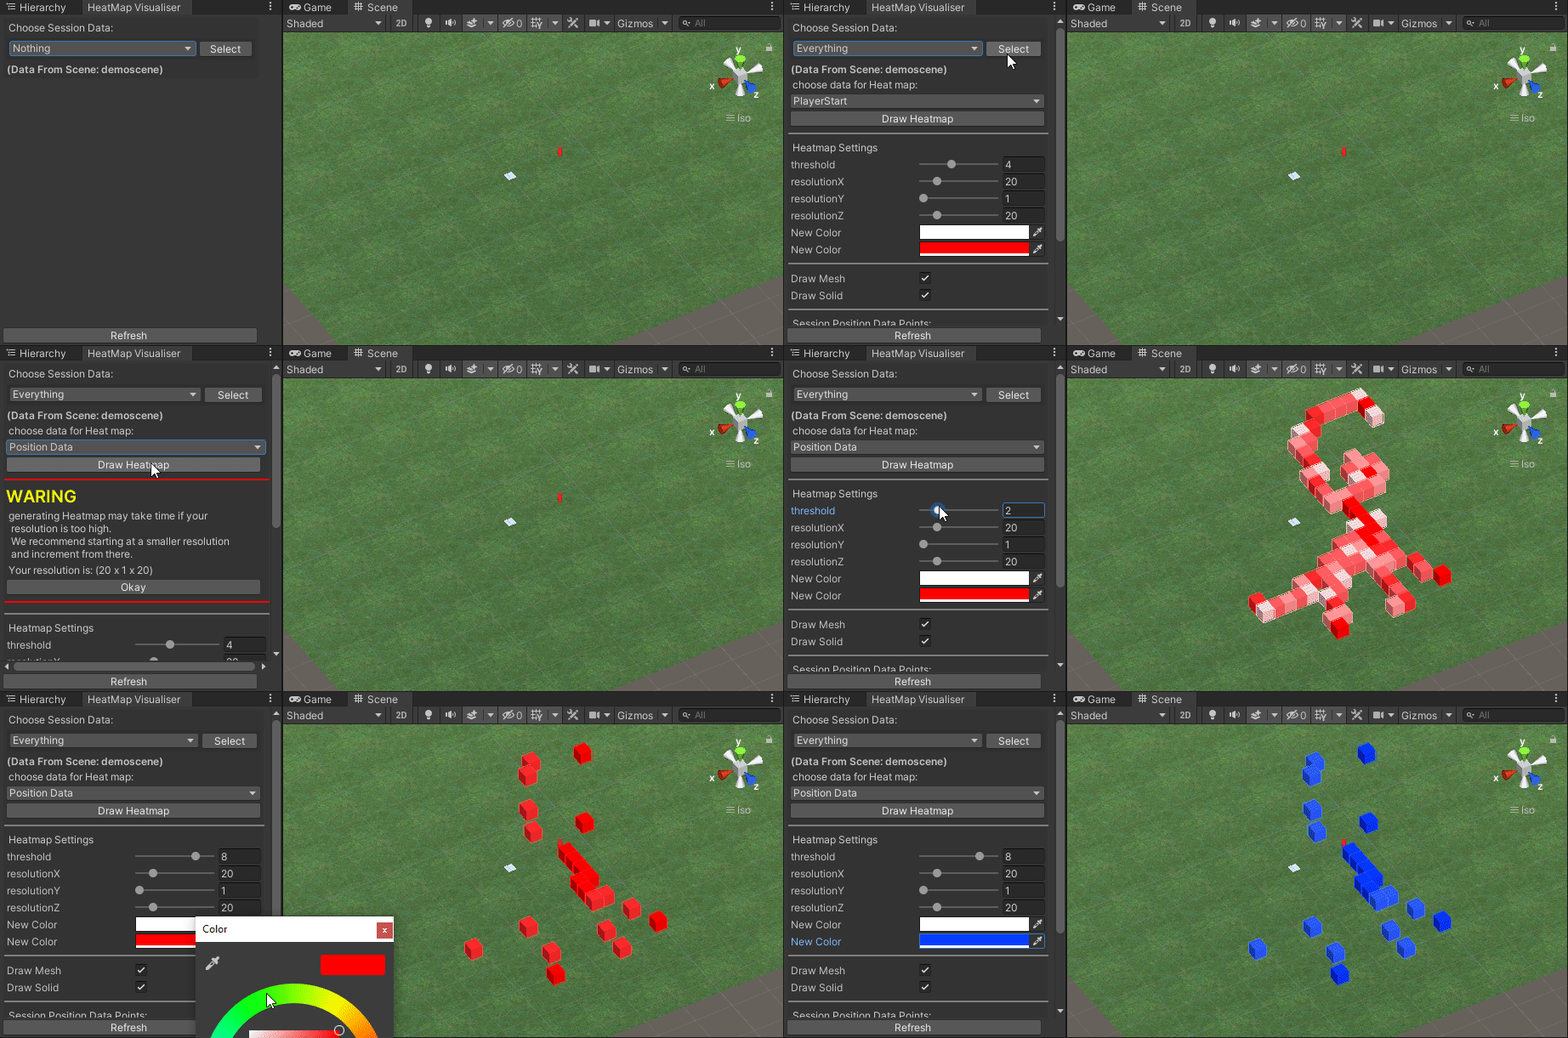
From the collected data the tool generates a 3D heatmap showing frequented events in areas specific areas. It draws a grid with the number of cells set by the developer. It then counts the events that happened within the bounds of each cell. The cells are then varied in colour depending on the magnitude of events that took place within their bounds.
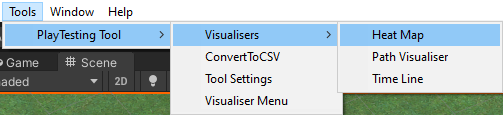
The window is located from the taskbar Tools > Playtesting Tool > Visualisers > Heat Map
-
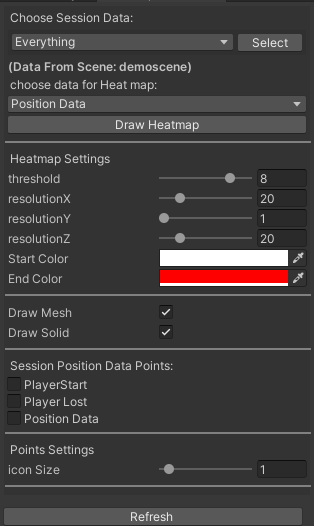
Choose Session Data:
- A list of session data folders with progression data with position data and position data. Select the data you wish to visualise.
-
Choose Data for Heatmap:
- Options of events to draw a heatmap.
- Generated from progression events as well as positional data.
- threshold:
- Minimum amount of 3d Points needed to be drawn in the scene view.
- resolution:
- The number of cells in the heatmap grid on the specific axis.
- Color:
- The cell drawn will be a colour between
Start ColourandEnd Color. - Start Colour: 0 points in the cell.
- End Colour: max points in the cell.
- The cell drawn will be a colour between
- Draw Mesh:
- Draw a mesh grid to represent the cell.
- Draw Solid:
- Draw a solid cube to represent the cell.
These draw the exact points of the position data selected
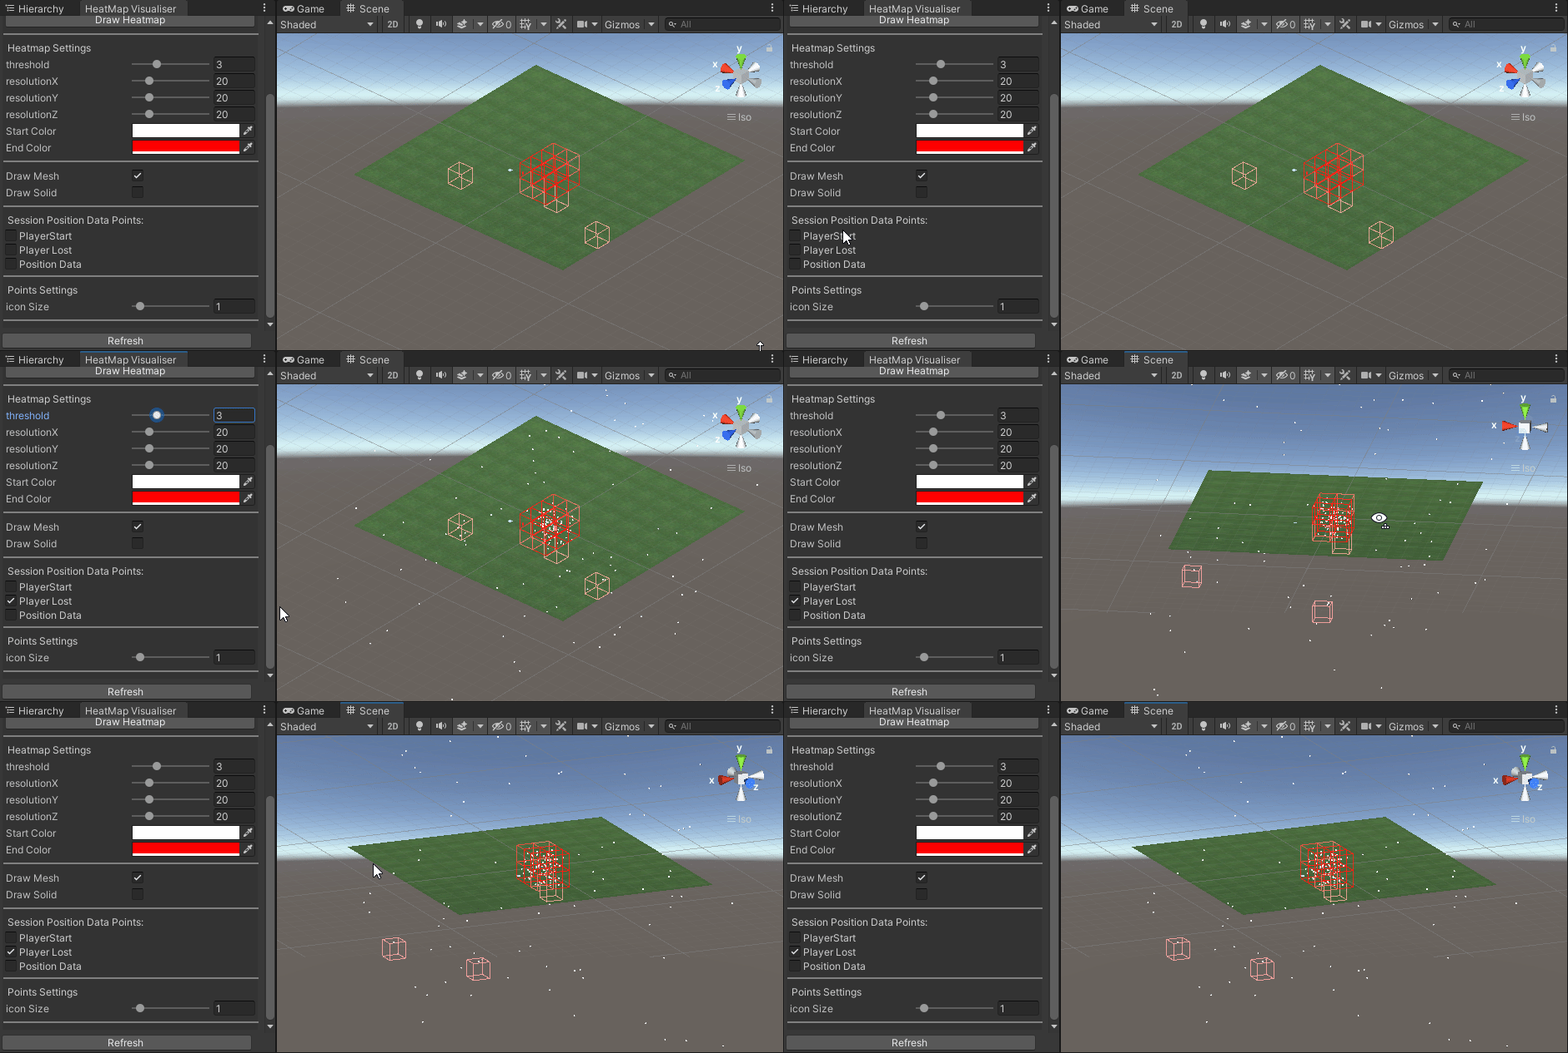
- icon size:
- Size of the 3D point drawn on the scene.
- Drawing the heatmap can be intensive and take the time we recommend starting at 202020 and going no further than 505050 for 3D games.
- For 2D games set the Z-axis to 0.
- for Topdown views set the Y-axis to 0.