Repository navigation
EN lab 03
Workshop index | Français | Previous: Search | Next: BYOM
Capture an agent's telemetry in Azure Monitor Application Insights, then verify a synthetic event without collecting conversation contents. Allow about 60 minutes, plus access approval and telemetry ingestion time.
Important
Initial result: Native Monitor inspected live; Application Insights/KQL path initially blocked. The signed-in current Monitor displayed no data for October 13-19 and restricted transcript access. Existing Preview History independently exposed the earlier directory, email and failed-search activities; these were not rerun. The classic navigation menu exists, but its destination failed to load during inspection. Seven unrelated Application Insights resources were left untouched. A later approved paid test created dedicated telemetry resources, emitted one explicitly synthetic event with Entra ID, and verified its exact operation/run correlation through KQL. This proves the Azure ingestion/query layer, not agent-originated telemetry or configuration of the saved agent. See the actual results and screenshots.
On October 20, an isolated Standard draft agent was created through the
supported portal and cloned with official PAC. Its native
LogCustomTelemetryEvent topic passed 13 schema checks and official offline
packaging, then exactly one topic change was pushed.
The owned Application Insights connection was saved and verified by navigating
away and back. Conversation-detail, sensitive-property and node-execution
logging were all off before the single operator trigger at
19:49:32 UTC. The actual test chat replied Telemetry check requested.
An independent app-scoped KQL query found exactly one
WorkshopTelemetryCheck event with all five expected synthetic properties,
including the unique correlation marker. No external synthetic emitter or
repeat trigger was used. This passes the actual agent-originated event and
KQL correlation boundary that the earlier Azure-only test could not establish.
The execution record and ingestion evidence remain separate. Platform event dimensions still include conversation/channel identifier keys despite those privacy switches; their values are not published. The timestamps come from separate client/service clocks, not an exact latency measurement. The existing agents were untouched and no agent was published. At 19:55:31 UTC, saved settings were read back after navigation: the connection was empty, logging was off and all three privacy flags remained off. The first save had retained the connection despite disabling logging; an explicit field clear, blur and second save corrected that. The disconnection receipt proves remote disconnection, not Azure resource deletion. The separate cleanup receipt verified deletion at 19:58:02 UTC: the group, workspace, Insights component and specifically authorized component-scoped alert each returned HTTP 404. The referenced shared action group returned HTTP 200 before and after and was untouched. The private connection-string handoff was removed. Historical ingestion charges may still settle.
- On the existing agent, select Monitor from the Build/Preview/Evaluate/Monitor menu.
- Record the selected dates and whether the dashboard actually has data. The observed range was Last 7 days, 10/13/26-10/19/26.
- Open Sessions > See all. The current identity saw zero rows and a transcript permission banner. Do not elevate permissions or publish merely to remove it.
- Inspect the already-recorded conversation through Preview > History. Its directory, email and failed-directory activity durations were 2.73s, 1.63s and 4.62s. Do not rerun the email for monitoring evidence.
- Keep native Monitor/History evidence separate from the Azure procedure below. An empty aggregate is not proof of zero consumption or zero true success.
The actual Monitor header showed zero sessions, zero average duration, 0% success and zero credits with No data yet. The existing History conversation separately showed 90.33 estimated credits. These are different scopes, not a discrepancy to resolve by inventing billing or claiming a free agent execution.
- Connect a development agent to a workspace-based Application Insights resource.
- Emit a harmless custom event with a repeatable test-case marker.
- Query the correct telemetry table for the selected scope.
- Separate test-canvas activity from published-channel activity.
- Explain why a dashboard, empty query, or user count does not prove agent quality.
You need maker access to a disposable copy of the Lab 01 or Lab 02 agent, an approved Azure subscription, permission to configure Application Insights and its Log Analytics workspace, and permission to read the resulting logs. Agree on cost, retention, data residency, and telemetry access before enabling collection. Use fictitious inputs only.
Open a standard-harness agent through … > Open classic experience or the existing agent list. This navigation is not an orchestration switch: the standard harness can use classic or generative orchestration. These agent-level settings are not instructions for the GitHub Copilot harness. See harnesses and standard-agent access.
The monitoring source has an internal “Lab 4” title. It is Lab 03 in this workshop, following its source-file order. The BYOM exercise is Lab 04.
- Replace “instrumentation key or connection string” with the Connection string field in Settings > Advanced > Application Insights. The current article's introductory sentence still mentions a key, but its numbered setup procedure explicitly requests the connection string.
- Use workspace-based Application Insights and select its approved Log Analytics workspace. A new workspace can incur additional charges and governance work.
- Use Enable logging, Log conversation details, Log sensitive Activity properties, and Node execution events as applicable to your tenant. Older screenshots can call these Log Activity or Log node tools.
- Keep conversation details and sensitive activity properties off for this lab. User IDs, names, message text, and tool arguments can carry personal data.
- Keep the Copilot Studio Dashboard workbook optional. Microsoft documents this monitoring view as preview, so gallery availability is not a completion gate.
- Do not equate agent-level events with environment-level OpenTelemetry spans.
The telemetry overview identifies
customEventsfor agent-level telemetry anddependenciesfor environment-level tracing.
- Save an export or approved backup of the disposable agent and record its existing telemetry configuration without placing credentials in the repository.
- In Azure portal, locate an approved workspace-based Application Insights resource. If none exists, request approval before selecting Create a resource > Application Insights.
- Use the authorized subscription, resource group, and region. Select the intended Log Analytics workspace or an explicitly approved new one.
- Review ingestion/retention charges, access permissions, and network policy. Do not change shared workspace retention to make this exercise work.
- After deployment, open the Application Insights overview and locate its Connection string. Transfer it directly into the approved configuration field in Exercise 2. Never include it in screenshots or a shared note.
- Open Logs from this Application Insights resource. Confirm that you can query the resource and identify whether the editor is resource-scoped or workspace-scoped. Record the scope, not its private identifier.
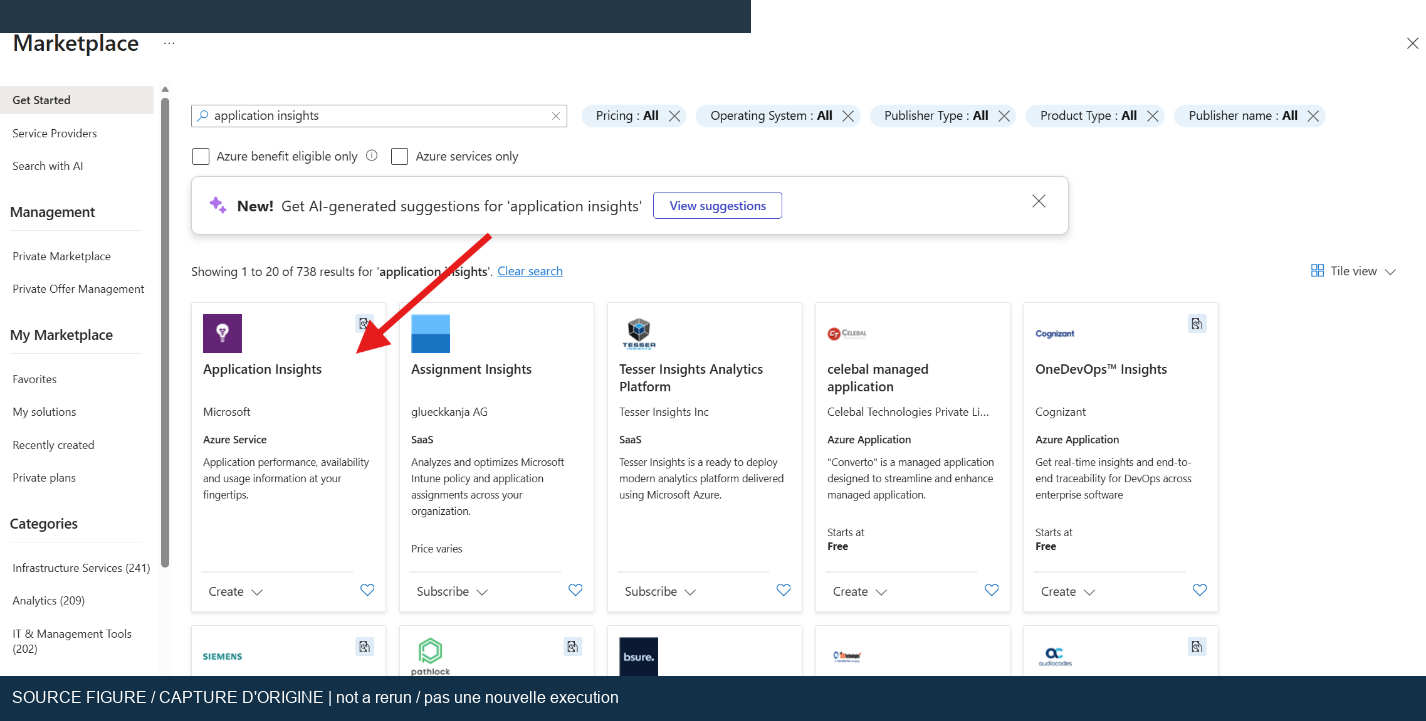
Original workshop screenshot, not a new execution. Resource creation requires approval; use workspace and region settings appropriate to your organization.
- In the standard agent, open Settings > Advanced > Application Insights.
- Enter the complete connection string, not a bare instrumentation key.
- Turn on Enable logging. Leave Log conversation details and Log sensitive Activity properties off.
- Enable Node execution events only if needed for this controlled test. Record the original value so you can restore it.
- Save the settings. Open a fresh test conversation after saving. Testing inside Copilot Studio can generate telemetry; publishing is not required to prove test-canvas collection. Publishing or testing a real channel requires a separate approval and is outside this review.
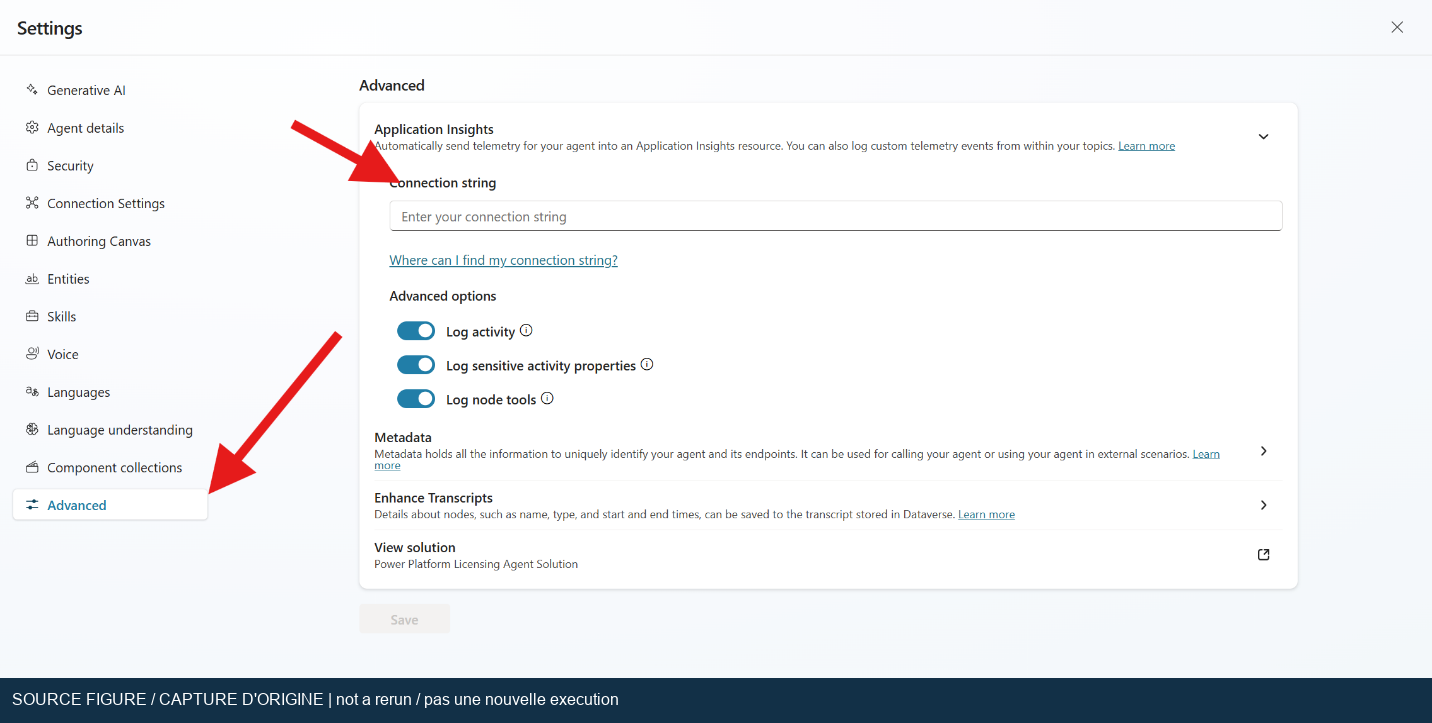
Original workshop screenshot, not a new execution. Current settings use a connection string and can display different logging labels.
-
In the disposable agent, create a topic named
Workshop telemetry check. -
In classic orchestration, add the trigger phrase
run workshop telemetry check. In generative orchestration, give the topic a precise description limiting it to an explicit request for that check. Do not change the agent's orchestration setting solely to obtain a matching screenshot. -
Add the Log custom event node from the node menu. If your tenant does not expose this node, record the limitation rather than substituting an unrelated connector or sending an external request.
-
Set the event name to
WorkshopTelemetryCheck. Supply a record of synthetic properties, using the formula editor where required:{ WorkshopId: "cs-lab-03", EnvironmentName: "Workshop", TopicName: "TelemetryCheck", TestCaseId: "MON-01" } -
Add a message after the event node:
Telemetry check requested. -
End the current topic and save. Run the trigger once in a fresh conversation, follow the topic path, and record the UTC time.
-
Do not put user messages, user roles, names, emails, keys, or licensing-guide text in the event.
EnvironmentNameis a chosen test label, not a claim about the environment's actual deployment stage.
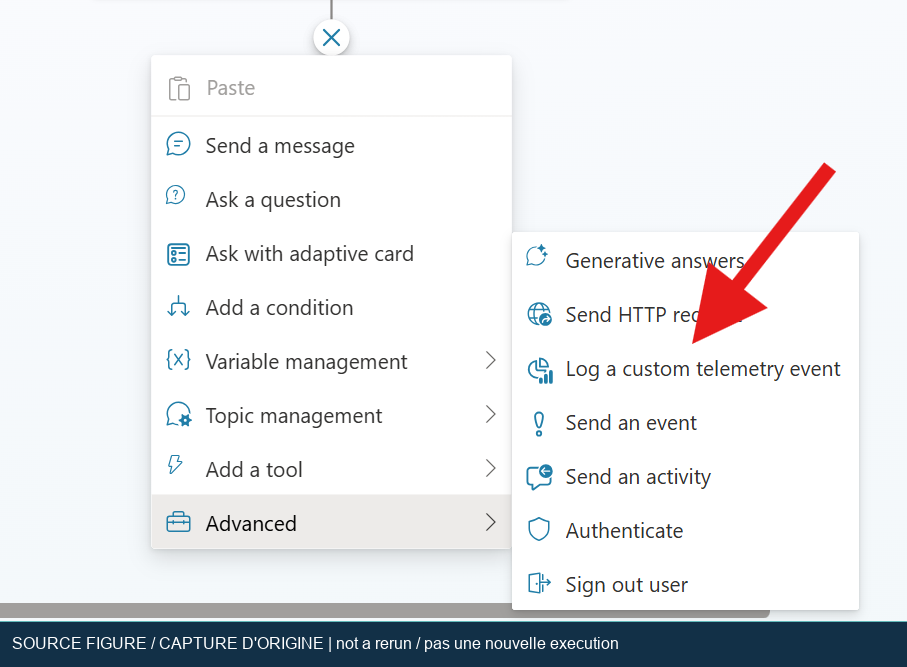
Original workshop screenshot, not a new execution. The new event uses fictitious properties and a distinct workshop marker.
Wait for ingestion, then run the discovery query from Application Insights >
Logs. Start with the broad result, because a custom-event node can be surfaced
through a platform envelope such as OnLogEvent rather than the label you chose.
Do not filter only on an assumed event name before observing the payload.
customEvents
| where timestamp > ago(1h)
| project timestamp, name, customDimensions
| order by timestamp desc
| take 50
Locate the event near the recorded UTC time and expand customDimensions.
Identify the actual event label and property layout, then use the matching
query. If the node's record is exposed as top-level dimensions:
customEvents
| where timestamp > ago(1h)
| where tostring(customDimensions.WorkshopId) == "cs-lab-03"
| project timestamp, name,
    TestCaseId=tostring(customDimensions.TestCaseId),
    TopicName=tostring(customDimensions.TopicName),
    DesignMode=tostring(customDimensions.designMode)
| order by timestamp desc
If properties are nested, inspect their actual location and adapt the property path. An empty result from this convenience filter does not prove that the event was never emitted. Do not claim a fixed payload shape without capturing it.
At Log Analytics workspace scope, Application Insights events use the
AppEvents table and the corresponding TimeGenerated, Name, and Properties
columns. Use this discovery query instead of renaming only the table:
AppEvents
| where TimeGenerated > ago(1h)
| project TimeGenerated, Name, Properties
| order by TimeGenerated desc
| take 50
If the workspace contains multiple applications, add the approved application's resource filter before interpreting results. Do not export the other applications' rows. The AppEvents reference documents these column names.
To exclude test-canvas events at Application Insights resource scope:
customEvents
| where timestamp > ago(1d)
| where tostring(customDimensions.designMode) == "False"
| summarize EventCount=count() by bin(timestamp, 1h)
This last query may correctly return no rows when only the test canvas was used.
It counts recorded event rows, not conversations, users, or unsampled executions.
Anonymous user_Id values are not reliable counts of distinct people.
- In Application Insights, select Monitoring > Workbooks.
- If available, open Copilot Studio Dashboard in the gallery.
- Choose the intended resource and time range. Check whether test traffic is included before reading a chart.
- Inspect topic and tool views, but do not infer request-duration or exception
coverage from the presence of a tab. The source lab's
requestsandexceptionsqueries need actual corresponding telemetry and dimensions. - Save a workshop copy only if authorized. Do not create alert actions or send email as part of this lab.
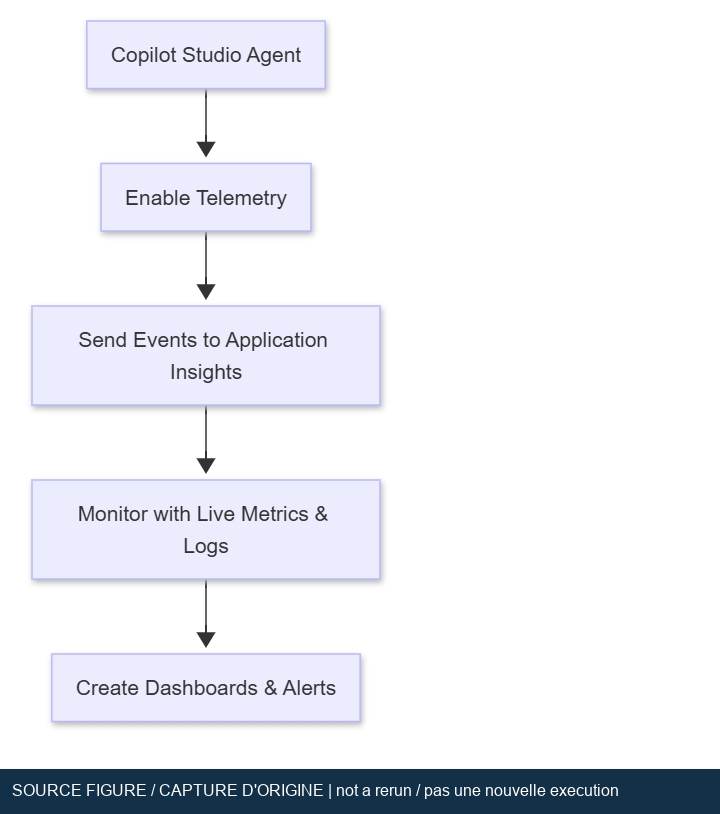
Original workshop screenshot, not a new execution. The diagram is conceptual provenance, not evidence that telemetry flowed in the reviewed tenant.
-
MON-01: Trigger the workshop topic once. Expect the visible messageTelemetry check requested.and a topic trace reaching the custom-event node. This proves the branch ran, not that ingestion succeeded. -
MON-02: Run the resource-scoped discovery query. Expect at least one event matching the trigger time and workshop marker after ingestion. Record the observed envelope, dimensions, and UTC timestamp. Do not require exactly one row because retries and delivery behavior can affect row counts. -
MON-03: Expand the event. Expect the synthetic test identifierMON-01and topic labelTelemetryCheckin the configured properties. Record any nesting before adapting the filtered query. -
MON-04: Run the published-traffic filter after test-canvas-only activity. Expect that the test events are excluded, not that published traffic exists. -
MON-05: Inspect the captured payload with sensitive settings off. Expect no deliberately logged message text or personal identifiers from this custom record. If sensitive data is observed elsewhere, stop export and escalate. Turning off a setting does not prove that every platform field is anonymous.
- For no events, verify resource scope, time range, saved connection string, logging state, topic execution, ingestion delay, and ingestion caps.
- For a missing
customEventstable, check whether the query is workspace-scoped and needsAppEvents, or whether the environment-level telemetry route is being inspected instead. Do not interchange event and dependency schemas. - For a blank property, inspect the raw dynamic object before casting it. Property names and case matter; an empty cast can mask a wrong path.
- For forbidden access, request the appropriate monitoring/workspace read permission. Copilot Studio maker access does not grant log access.
- For an empty Live Metrics or Performance pane, use Logs as the primary event check. Standard agent custom events do not imply streaming Live Metrics or automatic request/exception instrumentation.
- For a missing gallery workbook, record “optional preview unavailable” and continue with the event queries.
- Restore the agent's original connection configuration and logging switches. Remove the disposable topic or restore the saved solution.
- Remove only workshop-specific workbooks and resource permissions approved for deletion. Preserve any shared Application Insights resource/workspace.
- If resources were created exclusively for the lab, obtain approval before deleting them. Removing the connection does not purge previously ingested logs.
- Apply the approved retention and incident process to any accidental sensitive telemetry. Do not promise that deleting an agent deletes Azure Monitor data.
- Keep sanitized configuration evidence, UTC trigger time, topic path, discovery/filtered queries, observed event structure, and cleanup outcome. Leave all runtime cases Not run until executed.
The initial configuration/schema review was documentary only; the later connected test above supersedes its untested connection, node and delivery status. One native agent event was correlated in KQL, followed by verified remote disconnection and separate resource deletion. Do not reset those observed results to Not run. Published-channel behavior and the required privacy boundary remain open under T010; platform conversation/channel identifier keys were still present with sensitive logging off. Workbook availability is optional, not a reason to rerun the completed telemetry trigger or claim full lab acceptance.
The following Microsoft Learn pages were fetched on 2026-10-19.