Repository navigation
Insights
Insights in the admin top bar has three tabs: Analytics, Every pour and Logs.
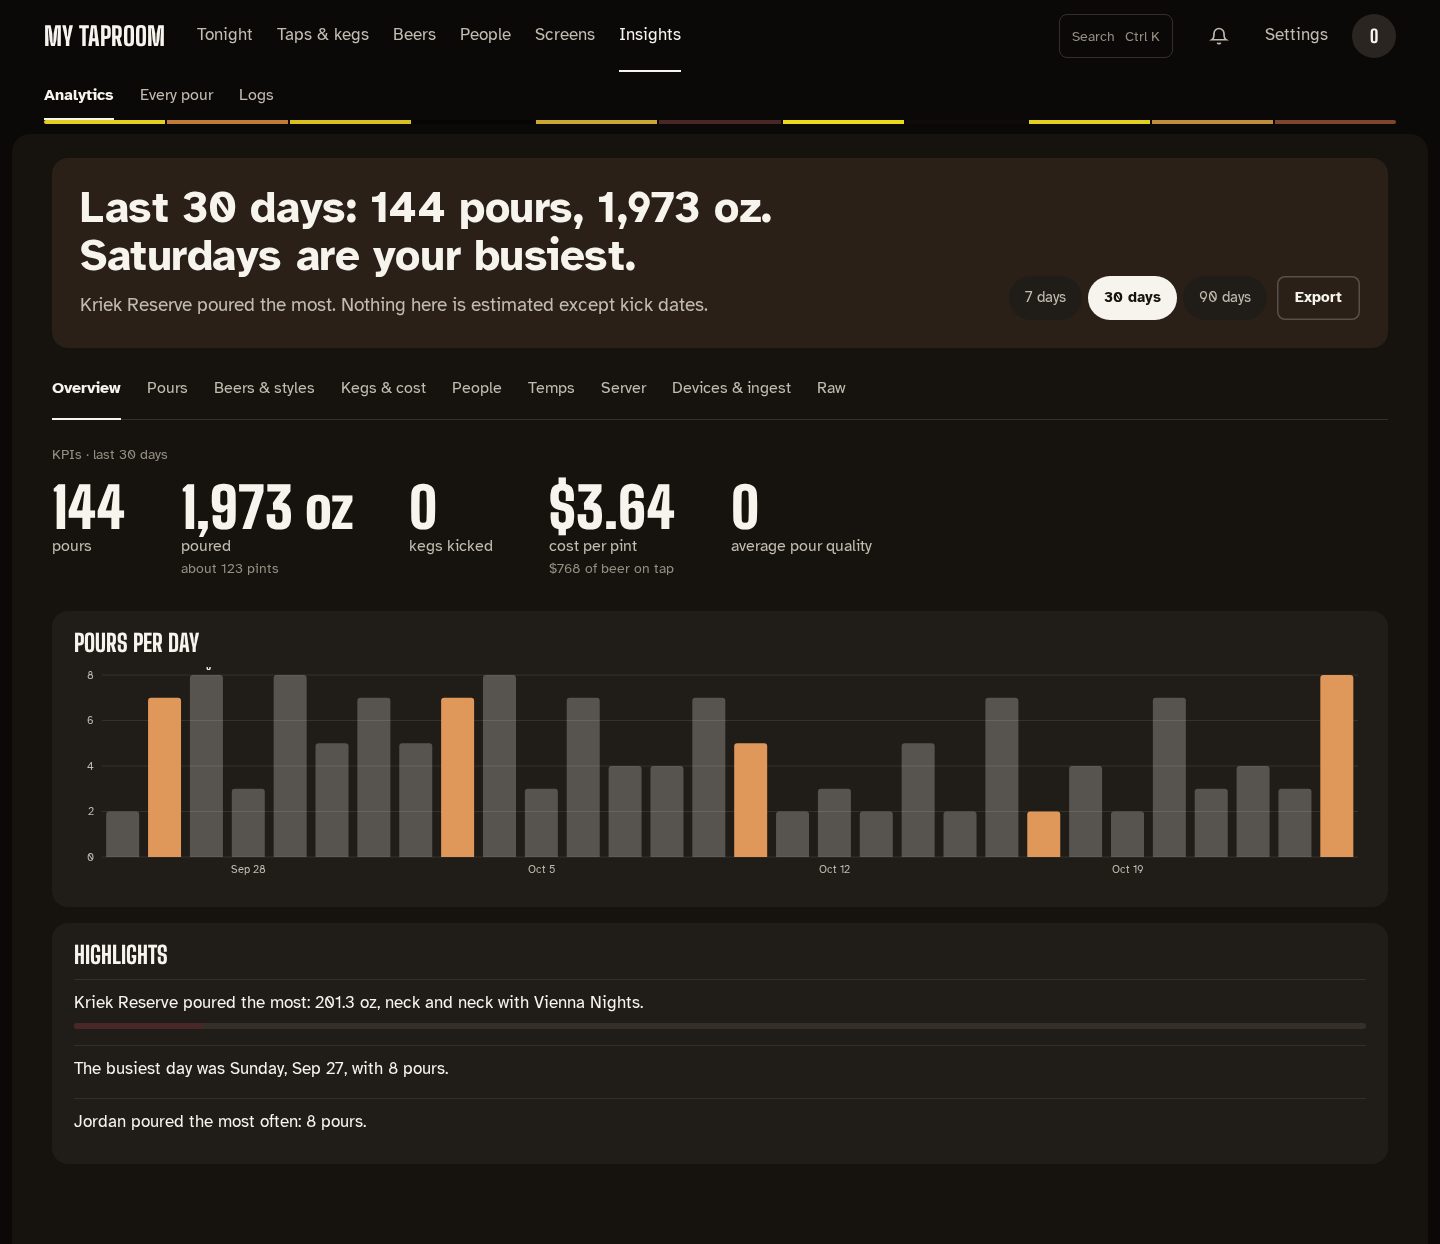
The page opens with a sentence about the chosen range ("Last 30 days: 141 pours, 1,942 oz. Thursdays are your busiest.") and which beer poured the most. 7 days, 30 days and 90 days change the range for everything on the page; Export downloads the figures as JSON.
The tabs:
| Tab | What it shows |
|---|---|
| Overview | Pours, volume (with about how many pints), kegs kicked in the range (by the day each keg was kicked), cost per pint (owners only) and average pour quality, then pours per day (the busiest weekday's bars in copper, the peak day labelled) and highlights written as sentences ("Kriek Reserve poured the most: 201 oz, a third more than Citra Haze.") |
| Pours | When people pour (a day × hour heatmap), pours by hour, and every pour in the range |
| Beers & styles | Volume by beer, and each beer's history: first tapped, kegs, total, rating, how many pours were claimed |
| Kegs & cost | Each keg on tap as one ranked list, soonest to kick first, each drawn filled with its beer, and a sentence naming the next to go; for admins, what each keg cost, cost per pint, value left and monthly spend |
| People | The leaderboard (this week, month or all time) and each pourer's history |
| Temps | Every temperature sensor's trend and 7-day range |
| Server | This server's CPU, memory and disk over the last day |
| Devices & ingest | Each source's state and UDP packet coverage per Kegtron |
| Raw | Each dataset as a CSV download; cost datasets for admins only |
A figure with no data shows —, never 0, with a line saying why: average pour quality reads "—, no Kegtron quality data yet" until a Kegtron reports quality scores.
The kegerator temperature charts shade the usual serving range (34–38 °F) and say above the chart whether the kegerator held it.
Pours are grouped by night (4 am to 4 am), each night with a header: how many pours, how much and how many are unclaimed. Each row has a tick in the beer's color.
Every recorded pour, newest first, with a sentence saying how many of tonight's pours have no name. Filter by Unclaimed only, a drinker, or a date range; change the name on a row, or tick several rows and Assign them to one person. See Cleaning reminders and unclaimed pours.
A live log of what Kegwall did: pours, sources, walls, the kiosk, automations and changes made in the admin. The sentence counts problems (warnings and errors) in the range. Search, pick a range (last hour, 24 hours, 7 days or 30 days), filter by source and level, and Follow live to keep new lines coming. Export JSON and Export CSV download what's shown. An error that repeats offers show similar; lines with more detail open with details.
Mirrored from docs/insights.md. Edit the repo copy; this page is regenerated from it.