Reporting
OPNGMS generates a per-tenant PDF security and activity report in the backend with WeasyPrint and delivers it by email through an operator-configured SMTP relay. This page covers what a report contains, how to configure SMTP delivery and per-tenant branding, the supported languages, schedules, and how the delivery pipeline runs. For the first-run setup walk-through see Installation; for the credential-encryption model see Security.
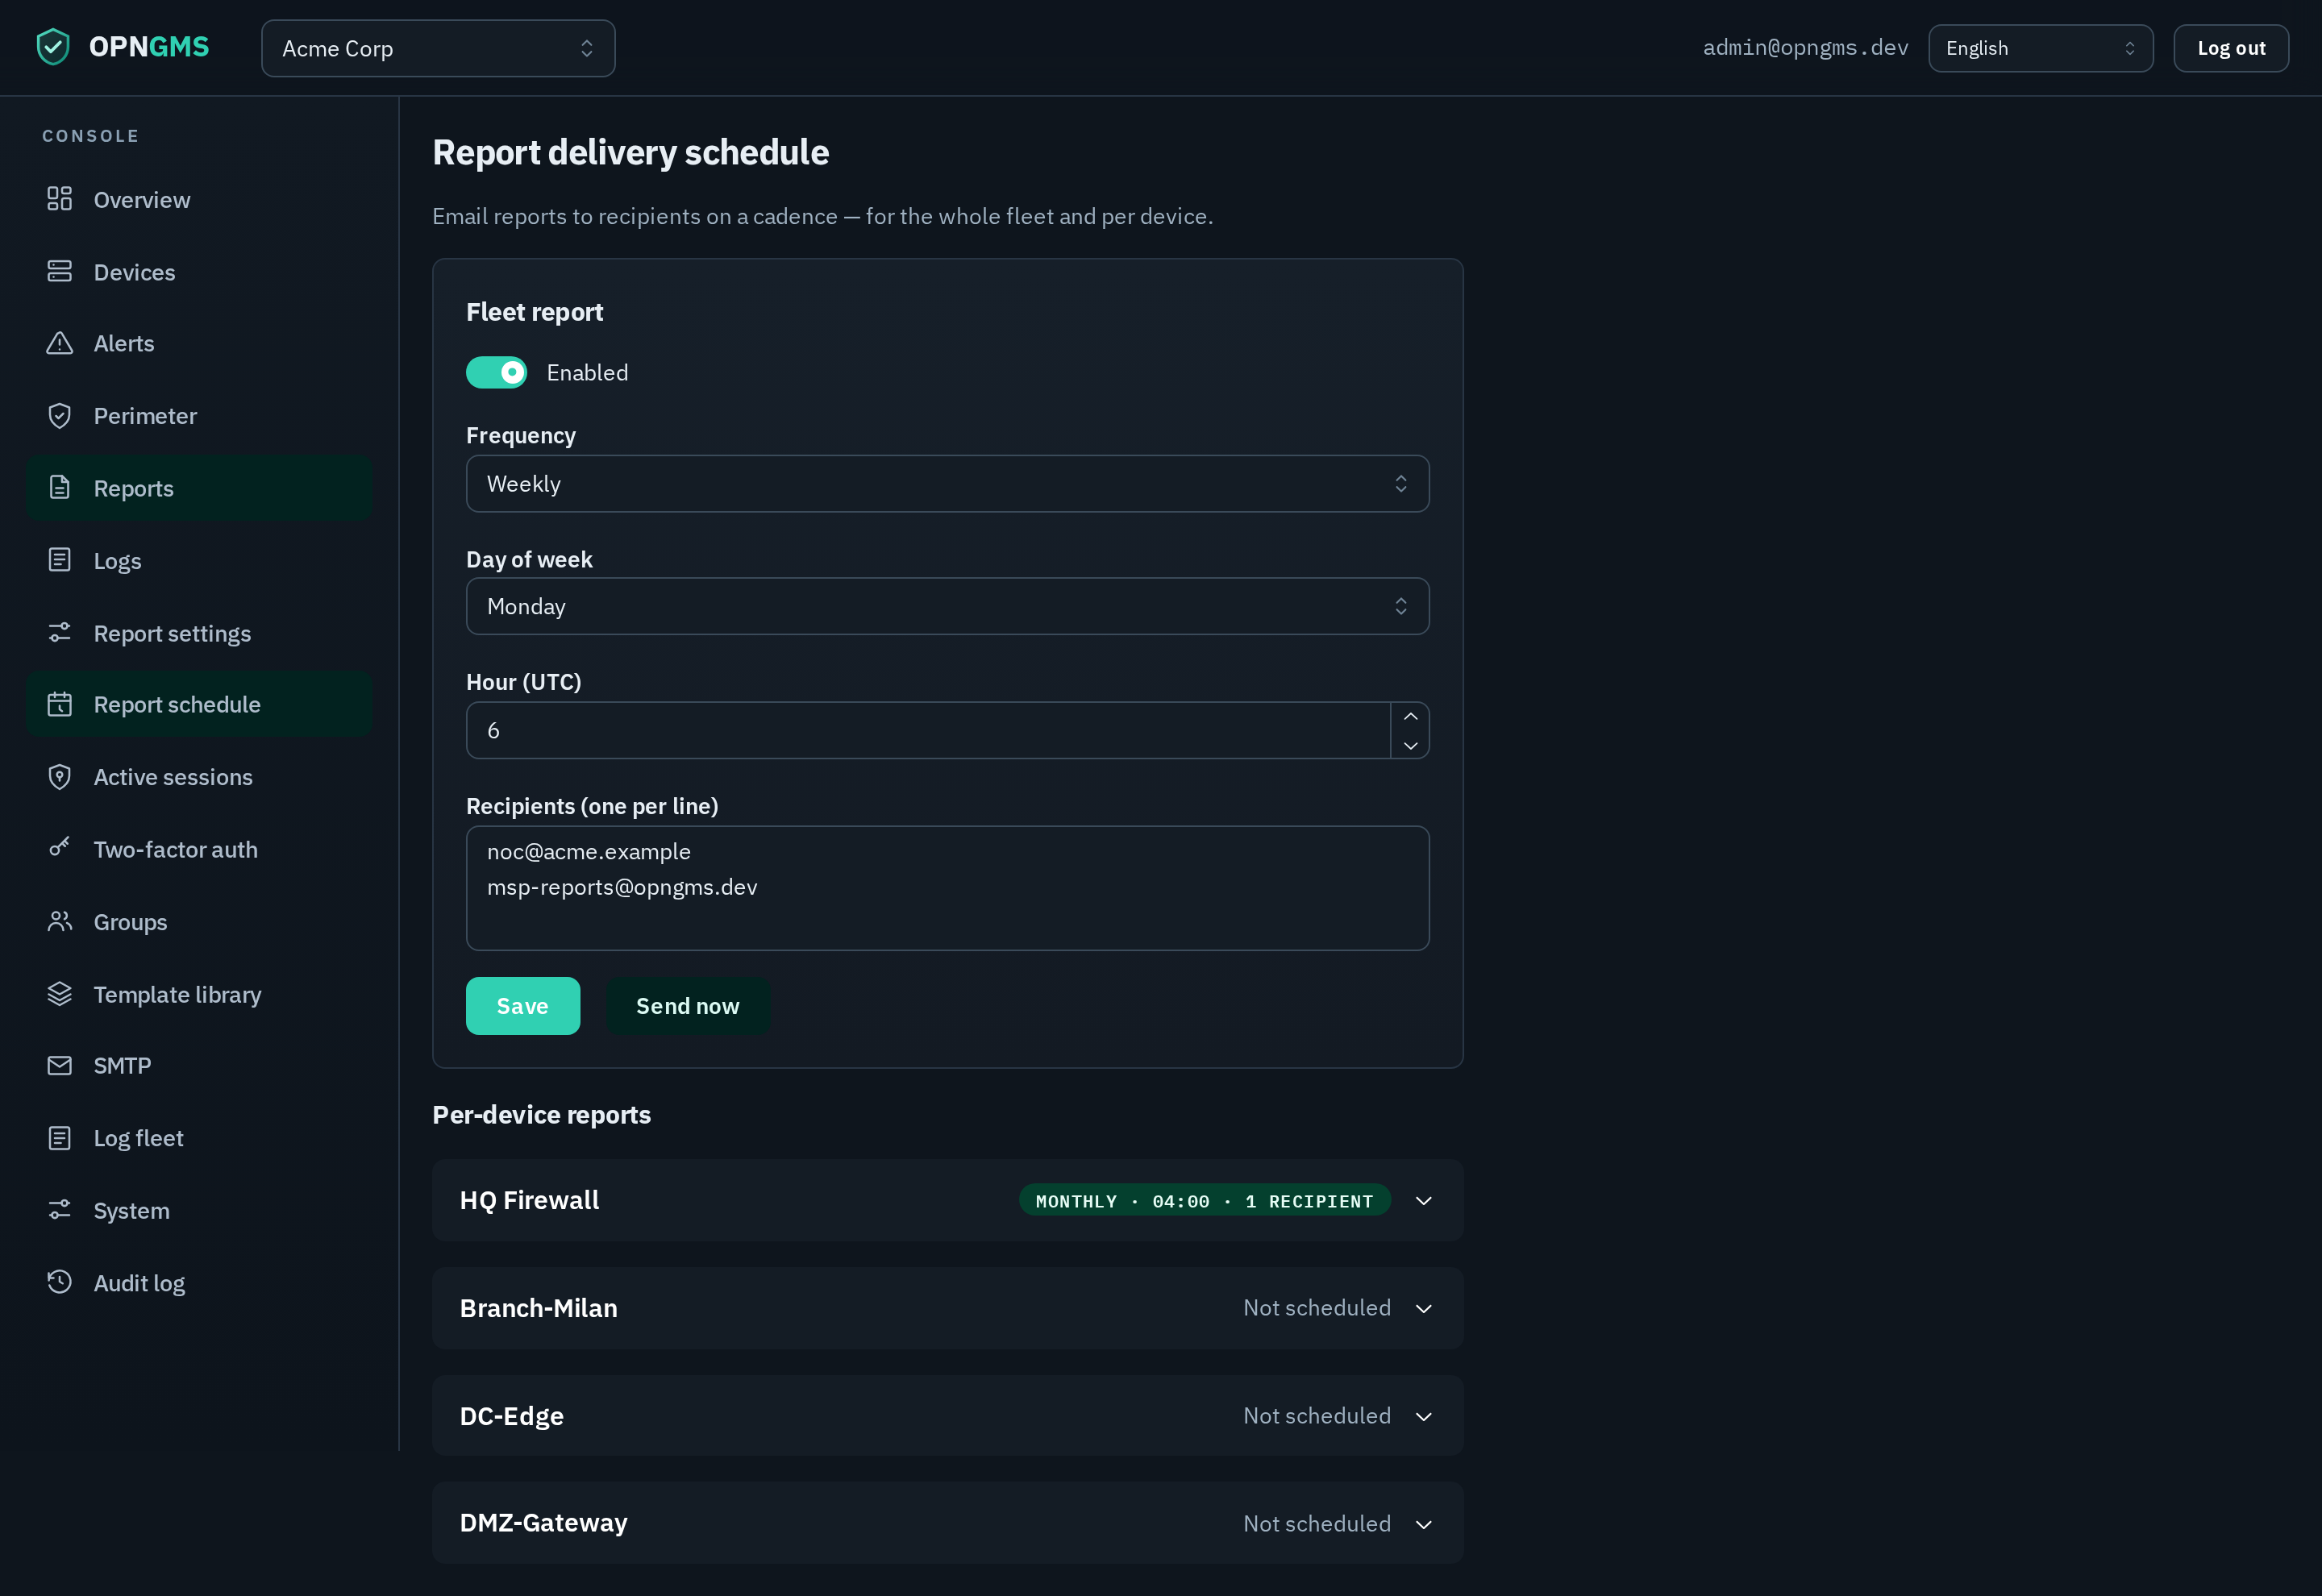
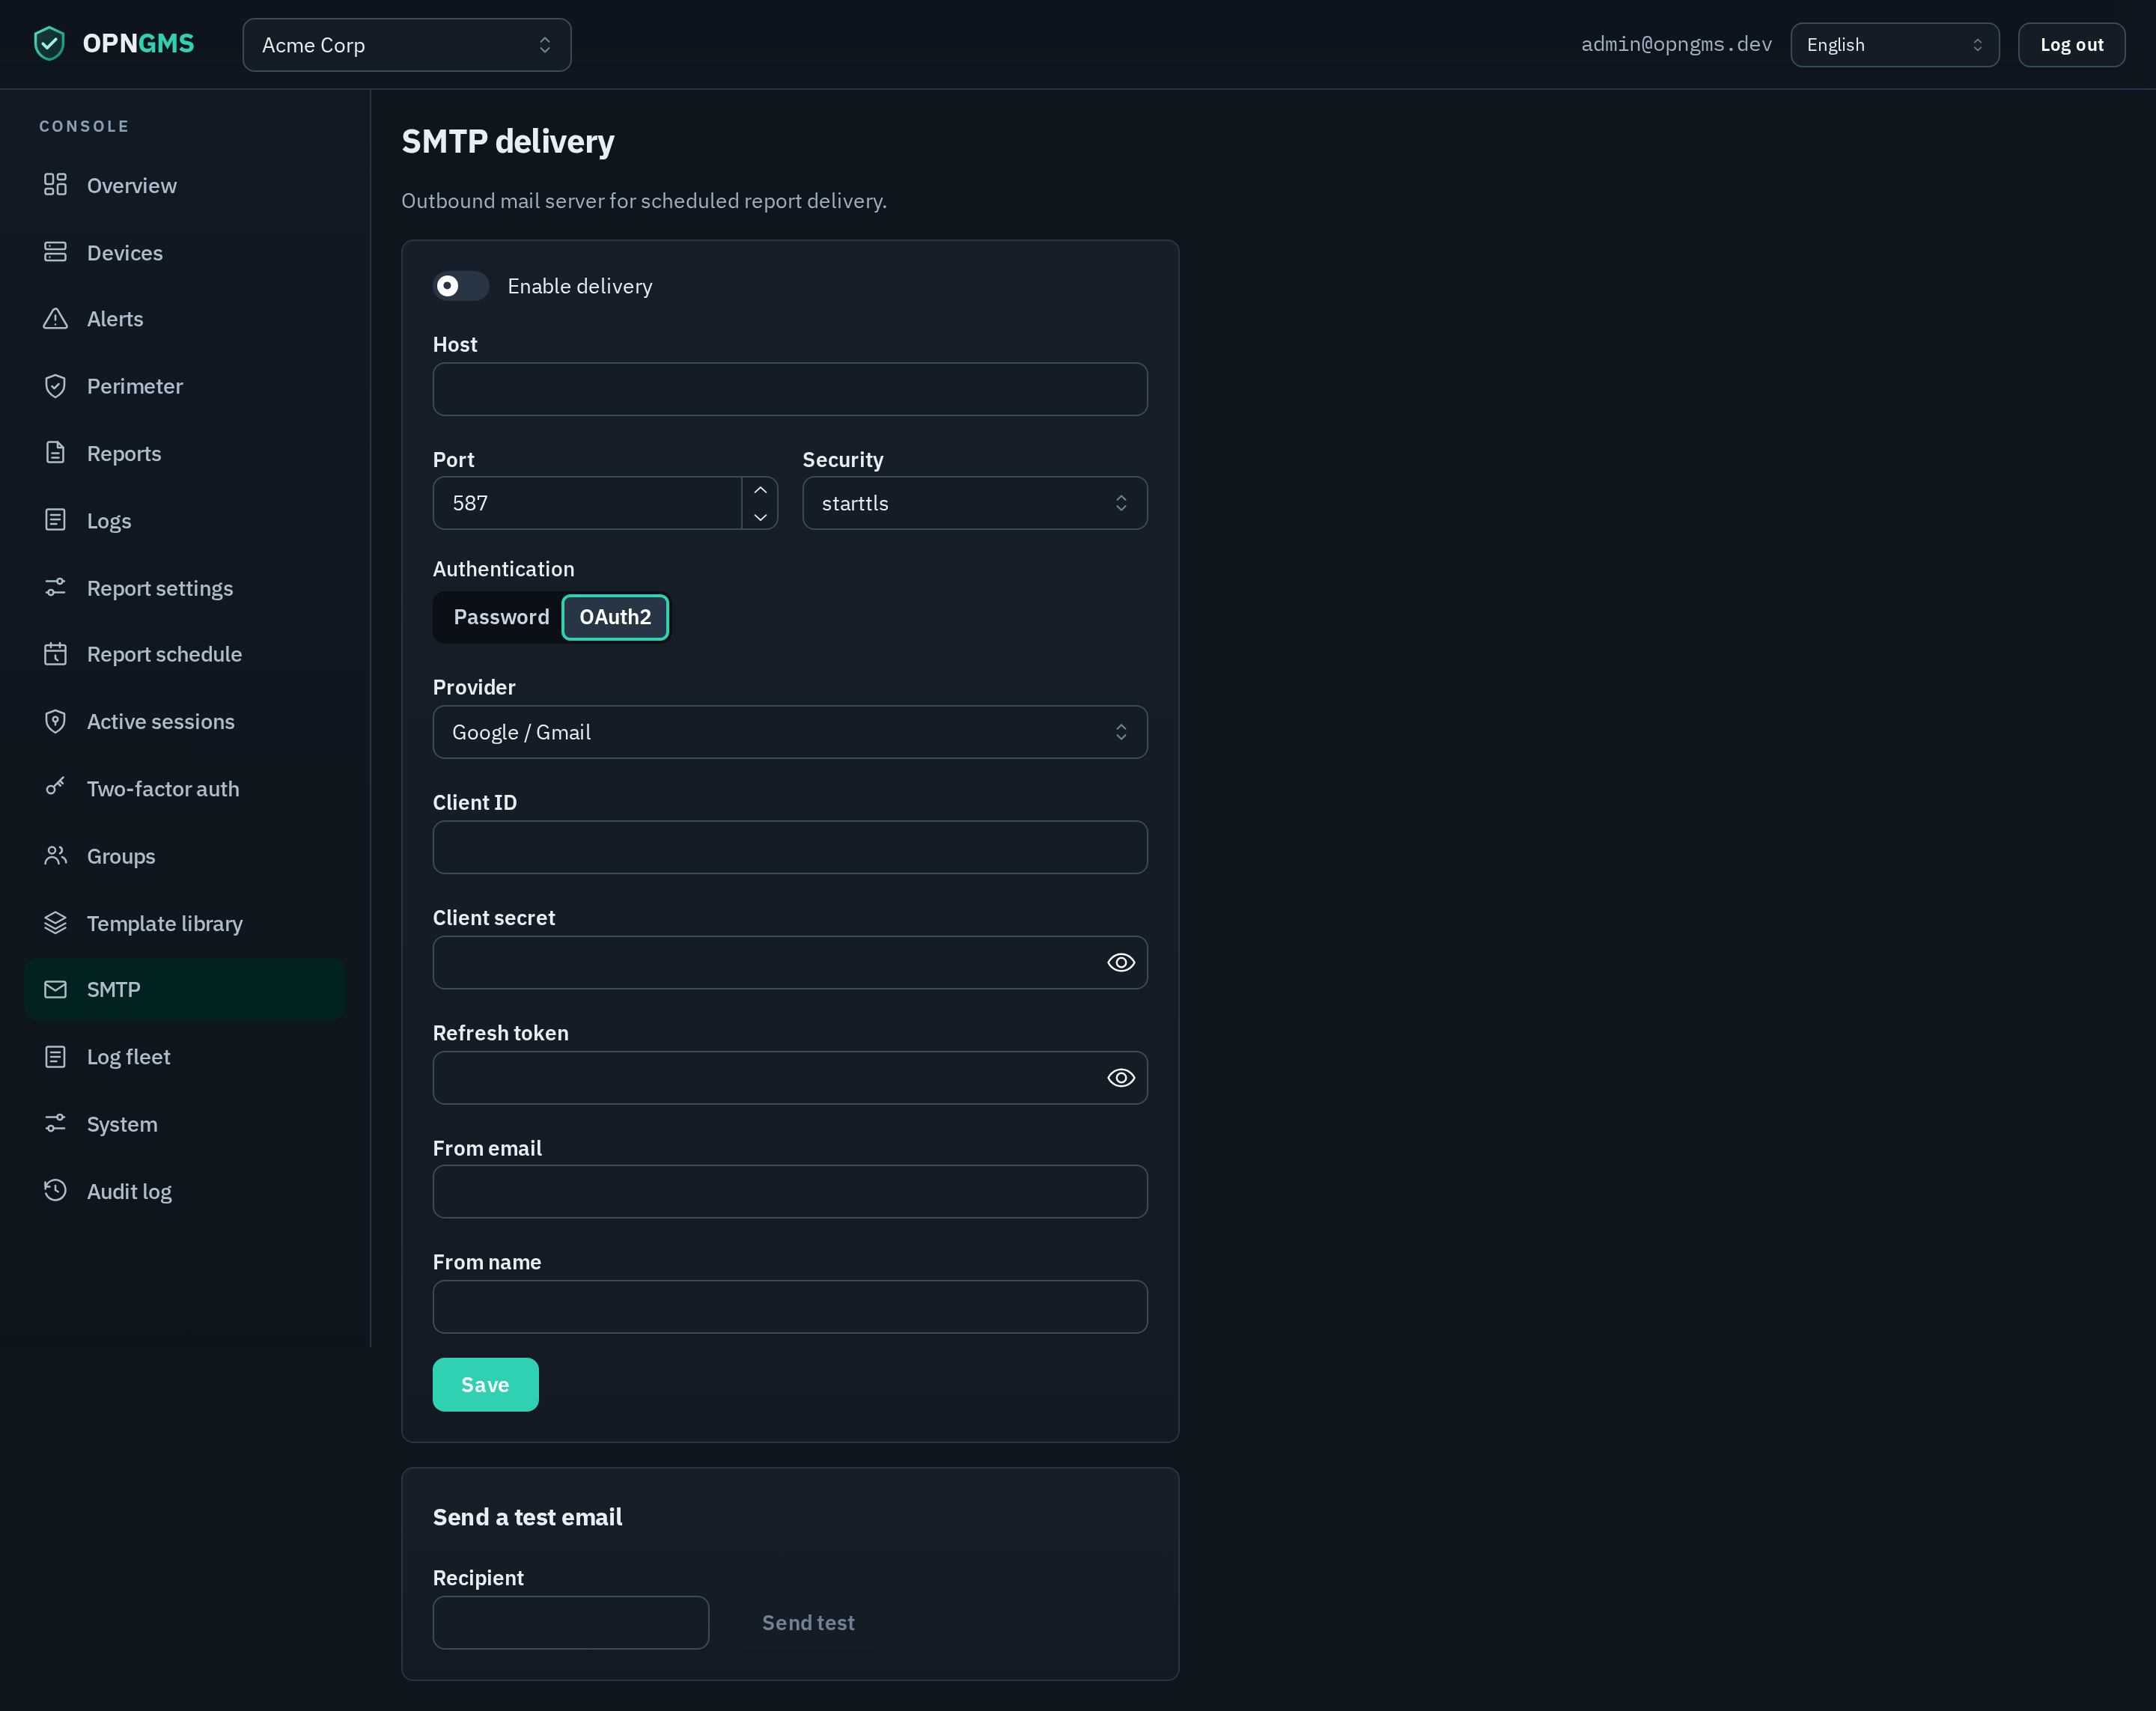
| Report schedule (fleet + per-device) | SMTP delivery |
|---|---|
 |
 |
- Overview
- SMTP delivery configuration
- Per-tenant report settings
- Localization
- Schedules
- Delivery pipeline
A report is a single PDF, scoped to one tenant, built entirely server-side from data OPNGMS already collects for that tenant's fleet. Each report covers a date range and contains a title page (tenant name, report title, optional logo, the covered period), a table of contents, and then one section per device. A report can cover the whole fleet (every device in the tenant) or a single device.
Each device section is assembled from these blocks:
| Block | Source | Contents |
|---|---|---|
| Attacks | IDS events | Intrusion attempts the firewall blocked over the period — a timeline chart plus ranked tables for top attempt signatures, top targets, and top initiators. |
| Attacker countries | GeoIP | The countries the period's attacks originated from, ranked by share, with a world choropleth map. |
| Failed logins | Perimeter events | Top attacker IPs failing authentication at the perimeter — source IP, country (GeoIP-resolved), the attempted username, and a count. |
| Firewall blocks | Perimeter events | Top attacker IPs the firewall dropped at the perimeter — source IP, country (GeoIP-resolved), the targeted port, and a count. |
| Web Activity | DNS | Lookup volume over time, plus top sites, busiest initiators, and top blocked domains. |
| Data Usage | Bandwidth | Throughput (in + out) over time, with total-in and total-out summaries for the period. |
| Up/Down Status | Availability | Whether the firewall was online and reachable, plus an uptime percentage. |
| Applications | Sample data | Applications seen on the network with a Low/Guarded/High risk rating. Labelled as sample data until application monitoring is ingested. |
| Web Filter | Sample data | Categories of web content requested, each with a risk rating. Labelled as sample data until content categorization is ingested. |
| Reliability | Service events | The period's reliability events — reboots, service crashes/restarts, and disk/FS warnings — grouped by category plus a recent-events list. |
| Config changes | Config-audit events | Who changed each box's config and how, attributed by channel — OPNGMS vs External API (the api channel split by OPNGMS's auto-learned management IP), plus WebGUI and console — with everything OPNGMS did not make (External API / WebGUI / console) highlighted as drift; a by-channel breakdown plus a recent-changes list. |
Every block is a report section that can be toggled. Sections are on by default; you turn them off per tenant in that tenant's report settings (see Per-tenant report settings), and any schedule can override that choice for its own runs. This is the single model for every section — there is no per-device "perimeter" toggle on the device detail page; the Failed logins and Firewall blocks sections use the same per-tenant / per-schedule selection as every other section.
All report data is rendered through Jinja2 with autoescaping on, and WeasyPrint is restricted to inline data: URIs only — it makes no outbound network requests while rendering, so report data can never trigger an SSRF. The queried range is capped (92 days maximum) to keep aggregation cheap.
Note: The Applications and Web Filter blocks currently render deterministic sample data and are explicitly marked as such in the PDF. The Attacks, Attacker countries, Failed logins, Firewall blocks, Web Activity, Data Usage, and Up/Down Status blocks are built from real collected telemetry.
OPNGMS ships no mail relay — you point it at an external SMTP server you provide. SMTP is configured in the app, not via .env: there is one global relay shared by all tenants, managed by an MSP administrator under the admin area. The settings are:
| Field | Notes |
|---|---|
| Enabled | Master switch. While off, scheduled deliveries hold and retry rather than send. |
| Host / Port | The relay address. Port defaults to 587. |
| Security |
starttls (default), tls (implicit TLS), or none. |
| Authentication |
Password or OAuth2. Google Workspace and Microsoft 365 are disabling basic-auth SMTP, so OPNGMS can authenticate with OAuth2 / SASL XOAUTH2 for Gmail and Microsoft 365 instead. |
| Username | Optional (Password auth). Leave empty for an unauthenticated relay. |
| Password | Optional (Password auth). Encrypted at rest and never returned by the API — responses only expose a has_password flag. |
| OAuth2 (when selected) | Choose the Provider (Google / Microsoft 365) and supply the Client ID, Client secret, and Refresh token (plus the Azure Tenant ID for Microsoft). OPNGMS exchanges the refresh token for a short-lived access token at send time and authenticates with XOAUTH2. The client_secret + refresh_token are Fernet-encrypted and never returned — only has_client_secret / has_refresh_token flags. Register an OAuth app at Google/Azure, grant the mail-send scope, and obtain a refresh token to paste here. PUBLIC_BASE_URL set (https) so the redirect URI ${PUBLIC_BASE_URL}/api/admin/smtp/oauth/{provider}/callback can be registered in your OAuth app. The button uses a signed, expiring state (CSRF) and is superadmin-gated, but it is untested against a live provider — pasting the refresh token by hand remains the supported path. |
| Default From | The From address used for every report email (unless a tenant overrides it — see below). For OAuth2 this is also the authenticated mailbox. |
| Display name | The friendly "From" name shown in mail clients. |
The relay password — and, for OAuth2, the client_secret + refresh_token — are encrypted with the same MASTER_KEY (Fernet) used for device credentials and decrypted only at send time (the OAuth access token is fetched in memory and never stored) — see Security. Because SMTP lives in the database (not the environment), you change it without restarting the stack. It is a single global singleton row, not a per-tenant setting; see Configuration for the related .env variables (MASTER_KEY, TZ) that affect reporting.
Before relying on scheduled delivery, use Send a test email: enter a recipient and the current form values, and OPNGMS sends a small test message (with a tiny text attachment) straight through the relay. A failure returns a redacted error string so you can fix host, port, security, or credentials without leaking secrets. Sending a test does not require saving first — it uses the values currently in the form (falling back to the stored password if you leave the password blank).
Branding and language are configured per tenant, so every tenant's report can look and read differently while sharing one global relay:
| Setting | Effect |
|---|---|
| Title | The report title on the cover and in the email subject. Defaults to Security & Activity Report. |
| Owner | An optional "report owner" label printed in the footer. |
| Logo | An optional PNG or JPEG (max 512 KB) embedded on the cover. The format is validated by magic bytes, never by the declared content type, and the stored bytes are streamed inline as a data: URI at render time. |
| Timezone | A display timezone printed in the footer. It affects how the report labels times — it does not change schedule firing (see below). |
| Language / locale | The language the whole report renders in (see Localization). |
| White-label sender | An optional per-tenant from_email. When set, it overrides the global Default From for that tenant's report emails, letting an MSP send each client's report from a client-branded address. |
| Sections | Which report sections (Attacks, Attacker countries, Failed logins, Firewall blocks, Web Activity, …) appear in the tenant's reports. Every section is on by default; clearing one drops it from every report for that tenant. A schedule can still override the choice for its own runs (see Schedules). |
The email subject is built from the tenant's report title, the tenant name, and the covered period, e.g. Security & Activity Report — Acme Corp — 2026-06-01..2026-06-08.
Reports are localized server-side. The report language is per tenant (the per-tenant language setting above), independent of any operator's UI language. Seven locales ship today, each a full translation of every section title, explanation, table heading, axis label, and footer string:
| Code | Language |
|---|---|
en |
English |
it |
Italiano |
es |
Español |
fr |
Français |
de |
Deutsch |
pt |
Português |
nl |
Nederlands |
Any unknown or partial locale falls back to English, so a report always renders. The available list is served to the UI, so the language picker only offers locales that are actually present.
A schedule decides when a report is built and who receives it. Schedules come at two scopes:
- Fleet-level (per tenant): one schedule covering every device in the tenant. There can be at most one fleet schedule per tenant.
- Per-device: a schedule targeting a single device. At most one schedule per device.
Each schedule carries a frequency, an hour, a recipient list, and an enabled flag:
| Frequency | Behaviour | Window covered |
|---|---|---|
| Weekly | Fires on a chosen weekday (Mon–Sun) at the configured hour. | The prior 7 days. |
| Monthly | Fires on the 1st of each month at the configured hour. | The prior calendar month. |
| On-demand | Never fires automatically. | The prior 7 days when sent manually. |
Recipients are validated, lower-cased, de-duplicated, and capped at 50 addresses per schedule.
A schedule can also carry its own section selection, which overrides the tenant's report settings for that schedule's runs. Leave it unset to inherit the tenant defaults; set it to tailor one schedule (for example, a perimeter-only digest that keeps Failed logins and Firewall blocks but drops the activity sections).
Note: The schedule hour is interpreted in UTC, by design. Changing the container
TZonly affects how timestamps appear in logs — it does not shift when a report fires. A weekly schedule set to hour4fires at 04:00 UTC regardless of the host timezone.
A report can never be configured to cover more days than the tenant's effective data retention for the stores its enabled sections draw on — there is no point promising a 90-day attack timeline if the underlying data is only kept for 30. The guard runs for both on-demand and scheduled reports: a request whose range exceeds the relevant effective retention is rejected (400 / 422), never silently clamped to a shorter window.
Retention is a global default with optional per-tenant overrides (configured on the tenant's Retention card — see Configuration). Lowering a tenant's retention is allowed even when reports already cover a longer range, but it surfaces a warning on that tenant's Retention card; lowering the global default additionally returns the list of impacted tenants to the superadmin, so the over-long reports can be adjusted.
Every schedule (including on-demand ones) has a Send now action for immediate, one-off delivery. It builds and emails the report right away to the schedule's recipients without advancing the schedule's cadence — the next automatic run is unaffected.
Scheduled delivery is driven by the background worker — see Architecture for the worker/queue topology:
-
Pick up due schedules. An hourly cron (
enqueue_due_reports) selects every enabled schedule whose next run time is at or before now and enqueues one delivery job per schedule. -
Generate + store.
deliver_scheduled_reportbuilds the PDF for the schedule's window (using the tenant's report settings and language), stores it as a generated report, and advances the schedule to its next run time. If the build fails, the cadence is still advanced so a broken report does not re-fire every hour, and the failure is recorded in the audit log. -
Email it. A separate send job emails the stored PDF (
opngms-report.pdf) to the recipients through the global relay, applying the tenant's white-labelfrom_emailif set. Sends retry on transport failure (roughly every 10 minutes, up to ~2 hours) before giving up.
The worker runs as the database owner (RLS-exempt) but every query is explicitly scoped by tenant id, and the send job refuses to email a report whose tenant does not match the schedule's tenant.
Where failures show up. Every outcome is written to the audit log under report.schedule.* actions — delivered, failed (after retries exhausted), generate_failed, no_recipients, device_missing, and tenant_mismatch. Transient progress and SMTP transport errors (redacted) appear in the worker logs. If reports are not arriving:
- Confirm SMTP is enabled and the Send a test email succeeds.
- Check the schedule has at least one recipient and is enabled.
- Remember the hour is UTC — the report may simply not be due yet.
- Review the audit log for the relevant
report.schedule.*action.
For deeper diagnosis (worker queue, Redis, log inspection) see Troubleshooting.
See also: Installation · Configuration · Security · Architecture · Troubleshooting