Analysis Workshops
The inspector's EELS · EDS · Diff tabs (and the Analysis / Window menus) open focused analysis workshops for spectroscopy and diffraction data. Each works on the active image; spectrum-image cubes (e.g. an EELS SI) are navigated frame-by-frame on the stage while the workshop shows the spectrum.
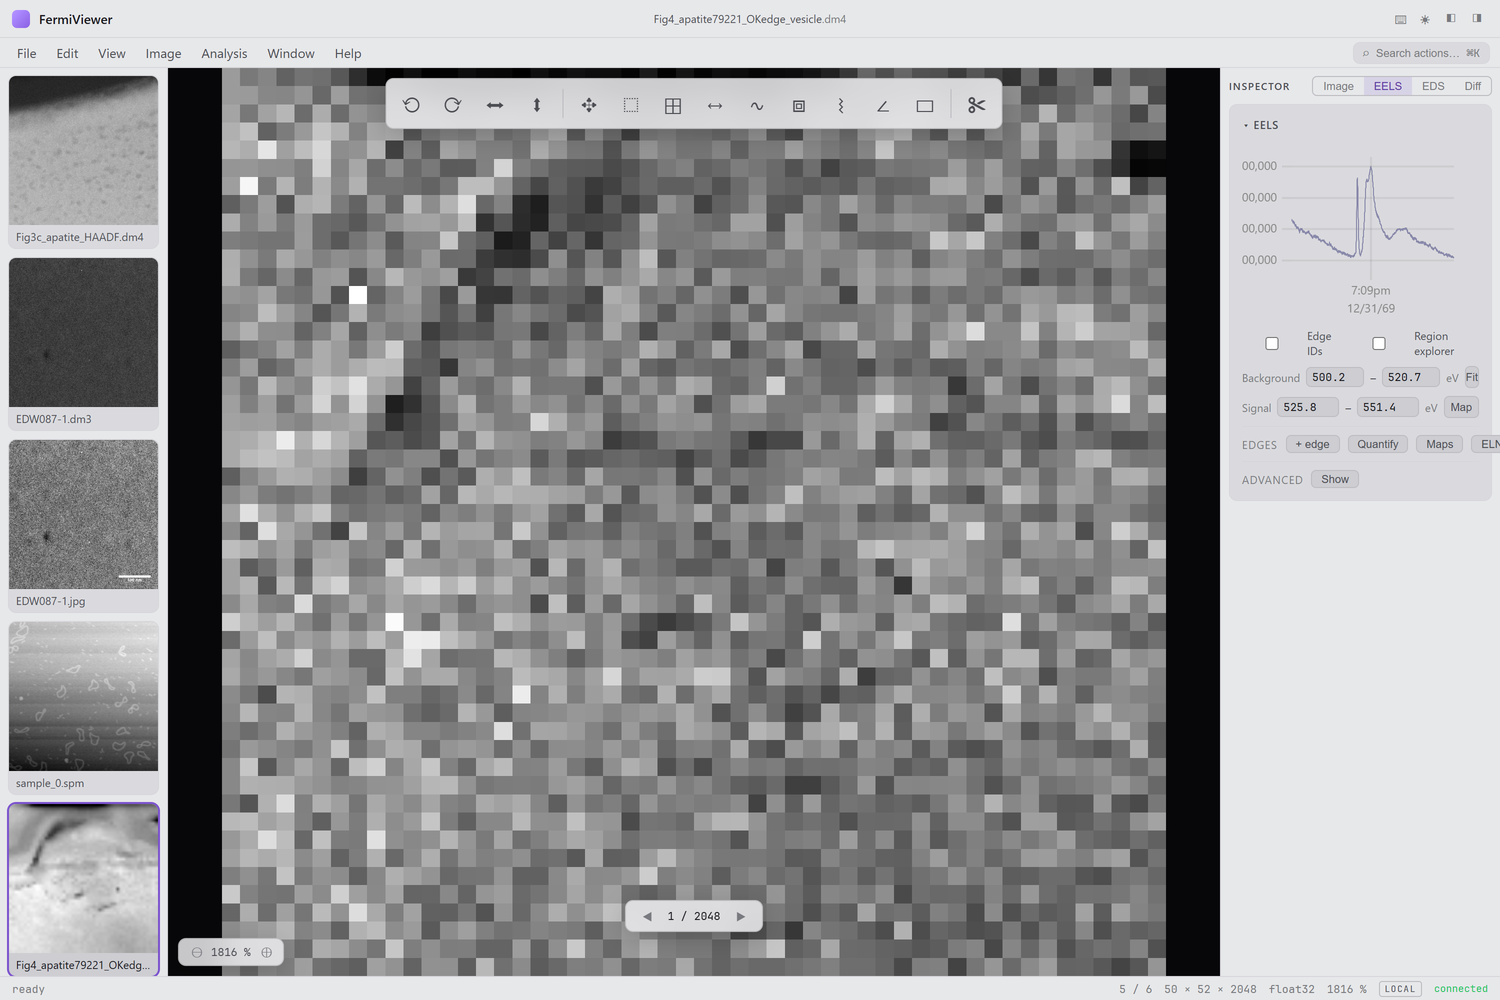
Open a spectrum or spectrum-image and switch to the EELS tab:
- Background fit — power-law (and other models) over a chosen pre-edge window, with a live signal/background split.
- Signal maps — integrate an edge window to map elemental signal across a spectrum-image.
- Quantification — relative composition from edge integrals.
- Thickness (t/λ) via the log-ratio / Fourier-log methods, plus Kramers–Kronig and SVD denoising utilities.
Pick the Edge vs Region mode, drag the background and signal windows on the spectrum, and read the result; for a spectrum-image, choose a region on the stage to get its summed spectrum.
The EDS tab works on an EDS spectrum-image (e.g. a Bruker hypermap):
- Composition maps — Cliff–Lorimer (and ZAF) quantification per pixel.
- Composite overlays — assign elements to color channels for a multi-element RGB map.
The Diff tab indexes diffraction patterns:
- Spot detection with sub-pixel centroids.
- d-spacings and phase indexing against candidate structures.
The Analysis and Window menus also expose GPA strain mapping, CTF estimation, atom-column finding, particle detection, FFT masking and filtering, drift alignment, and a surface/3-D plot — each in its own window. Grain segmentation and cross-section layer analysis have their own page: Structure & Grains.
Next: Structure & Grains.