Viewing and Display
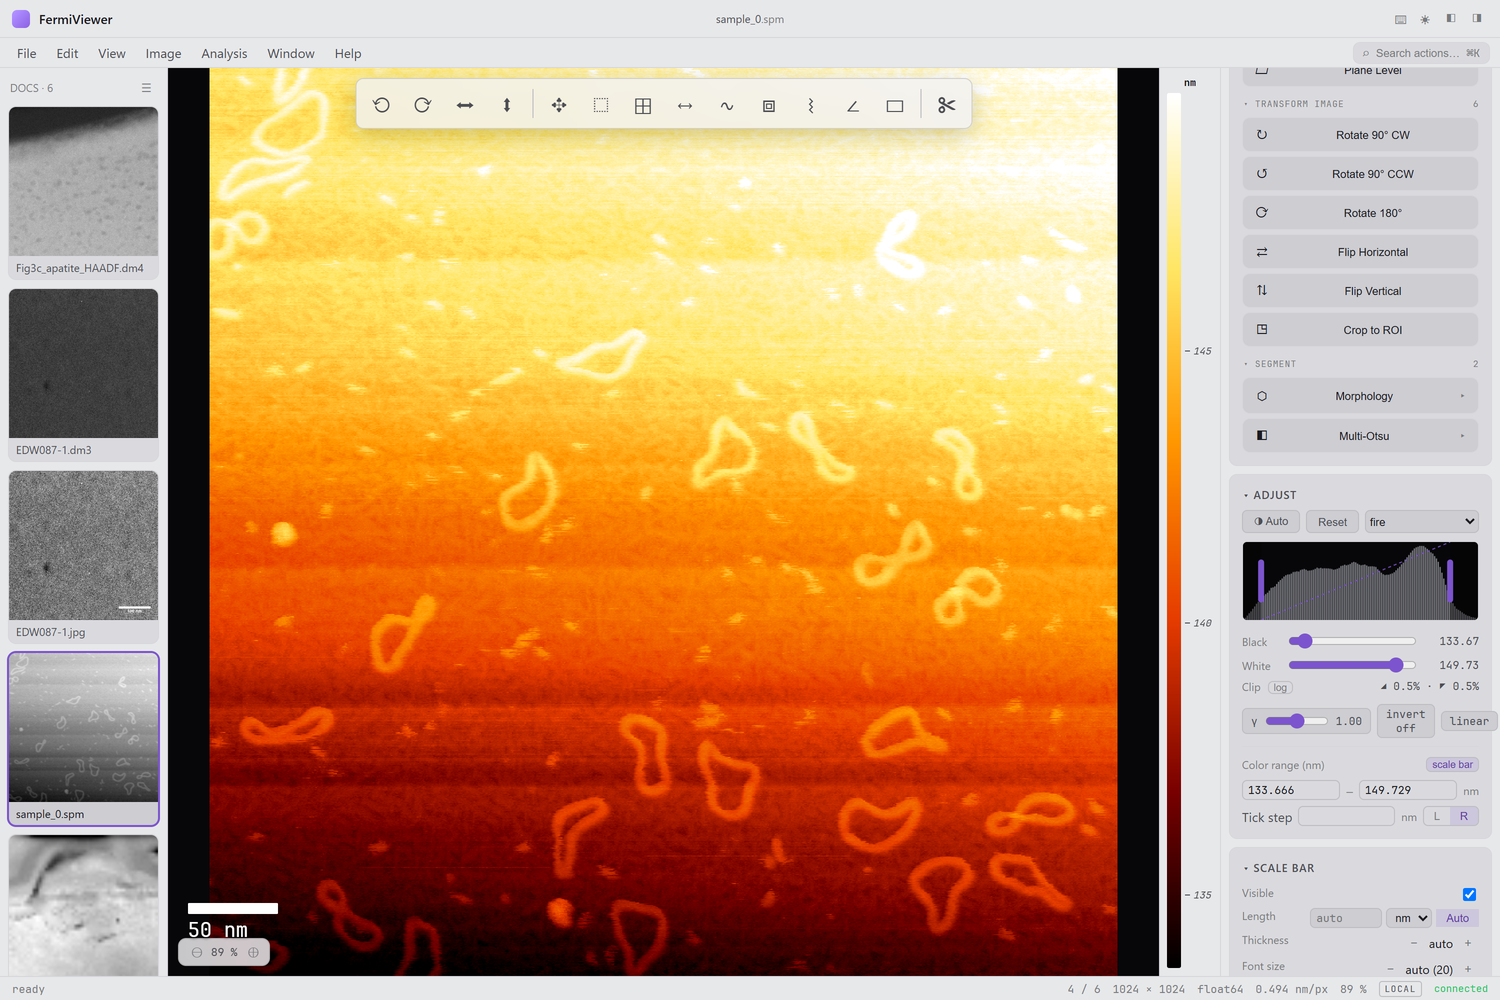
FermiViewer renders the raw image intensities on the GPU, so contrast, gamma, and colormap changes are instant at any zoom — no re-fetching. All display controls live in the Adjust card of the inspector.
- Histogram with handles — drag the black/white handles to set the display window. The clip percentages below show how much of the data is saturated at each end.
- Auto (◑) applies a percentile auto-contrast; Reset restores the full range.
- Gamma and Invert are in the chip row, along with an intensity transform (linear → log → equalize).
- Black / White sliders show the real values at each window edge.
The Color range controls (in Adjust) drive a calibrated color scale:
- Min / Max — type explicit limits in the image's real units (e.g. nm for AFM height) to fix the color mapping.
-
Tick step — the interval between labeled ticks on the color bar
(leave
0for an automatic "nice" step). - L / R — place the color bar on the left or right of the image.
- scale bar — toggle the color bar on or off.
The color bar sits in its own gutter beside the image (never overlapping it) and is labeled in real units, so a reader can map color → value directly.
Choose from gray, invert, viridis, inferno, fire, ice,
redblue, or a custom map. fire and ice are good for height/intensity
maps; gray is the default for STEM.
When an image is calibrated (most formats carry pixel size), a lateral scale bar is drawn on the stage. Configure it in the Scale Bar card: typed length, unit (Å / nm / µm), thickness, font size, and corner position. Both the scale bar and the color bar are baked into exports.
Next: Measurements.