Home
Electron-microscopy image analysis in the browser — TEM/STEM image viewing, EELS / EDS / diffraction analysis, a full measurement suite, and image processing. Python (FastAPI) backend + React frontend + an optional Tauri desktop shell. A ground-up port of the MATLAB fermi-viewer, verified against frozen MATLAB reference outputs and cross-validated against rosettasciio.
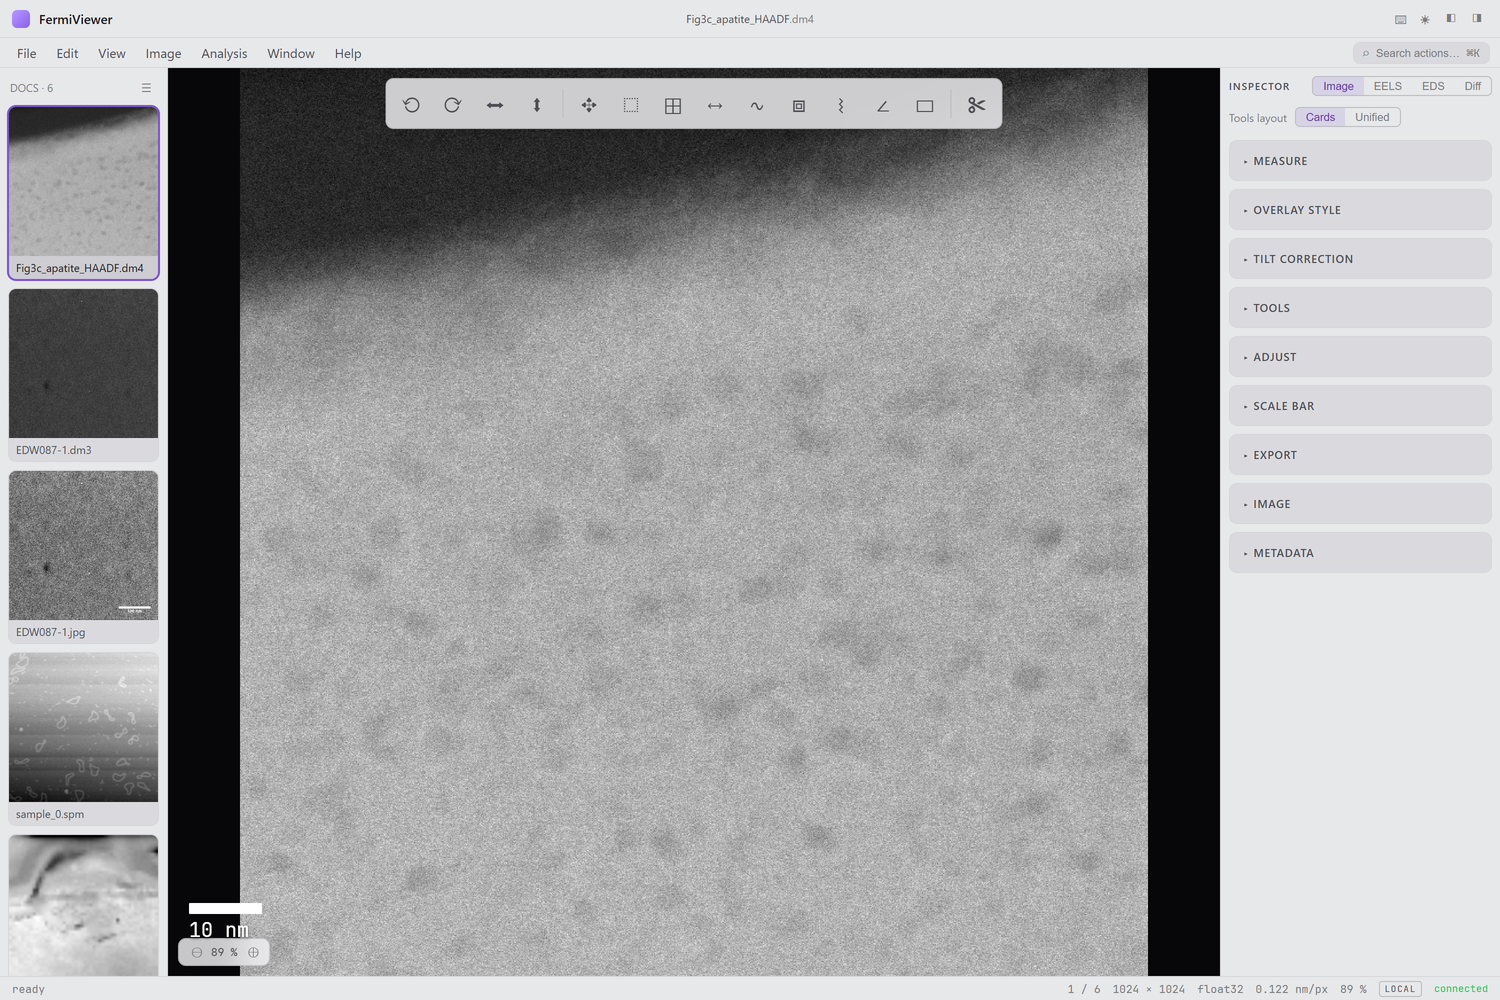
- Open many formats — DM3/DM4 (Gatan), BCF (Bruker), SER (TIA), MRC, TIFF, PNG/JPEG, headerless RAW, and Bruker Nanoscope AFM maps.
- View — GPU window/level/gamma with real-value contrast, a library of colormaps, a calibrated color scale bar, and a calibrated lateral scale bar.
- Measure — line/box profiles, distances, angles, ROIs (rect/ellipse) with live statistics, plus text/arrow/box annotations.
- Analyze — EELS (background, signal maps, quantification, thickness, Kramers–Kronig), EDS (Cliff–Lorimer / ZAF composition maps, composite overlays), diffraction (spot detection, phase indexing, d-spacings), GPA strain, CTF, atom columns, particles, grains (with a paint-to-train classifier), cross-section layers, FFT filtering, drift alignment.
- Export — publication figures with baked-in scale and color bars.
-
Install anywhere — Windows installer, standalone server, from
source, or an offline
fv-offline-*.zipbundle for air-gapped lab machines (needs only a 64-bit Python, no internet or admin rights).
| Page | What's inside |
|---|---|
| Getting Started | Install options and opening your first image |
| Viewing & Display | Contrast, colormaps, the calibrated color scale, scale bar |
| Measurements | Profiles, distances, ROIs, annotations |
| Analysis Workshops | EELS, EDS, diffraction, and more |
| Structure & Grains | Grain segmentation (incl. paint-to-train) + cross-section layers |
| AFM Support | Bruker Nanoscope height maps + the Z-scale color bar |
| Supported Formats | The full import table |
Screenshots throughout this wiki are captured from real datasets — a STEM HAADF image, a Bruker AFM scan, and an EELS spectrum-image.