Repository navigation
Statistics
Off by default. Switched on, the Pi takes one sample every fifteen minutes and keeps thirty days of them, so that three questions have an answer: how many messages per hour, how far the antenna reaches, how many aircraft a day.
sudo zenithboard stats on      # or: sudo zenithboard menu -> 7 Options -> 1 Statistics
zenithboard stats              # in the terminal
and in a browser, http://PI-ADDRESS:8080/stats. From a tablet, the gear panel on the wall carries a link to it, beside the version — but only while statistics are on.
Every quarter hour, as the zenithboard user and inside the same sandbox as the wall, the timer reads the decoder's stats.json and aircraft.json and writes one line to /var/lib/zenithboard/stats/stats.csv:
| Column | What it is |
|---|---|
when |
YYYY-MM-DD HH:MM, the time of the sample: the end of the quarter hour it measures |
messages |
Messages decoded in the last fifteen minutes |
farthest_km |
The farthest aircraft in that window, in km |
aircraft_pos |
Aircraft with a position at that moment |
aircraft_seen |
Distinct aircraft seen so far that day |
Which quarter hour a line counts in (0.99.22). A line's messages and farthest are the fifteen minutes before its time, so /stats and zenithboard stats show count them there, in that quarter hour's hour and day: the line of 2026-10-31 00:00 is 30 October's 23:45 to 24:00, in 30 October and the hour 23; the line of 14:15 is the hour 14's first quarter hour. Until 0.99.21 a line counted at its time: each day took the day before's last quarter hour and lost its own, each hour took the quarter hour before it, and the farthest's time was the end of its quarter hour. The aircraft with a position are a look at the line's moment and stay at its time; the aircraft of a day are its day files', which the sampler keeps by the day it runs in (the line after midnight adds the day before's last aircraft to the day before's file).
It also notes every aircraft's address into a file for the day, seen-YYYY-MM-DD, one per line, so the day's count is the number of distinct aircraft. After thirty days a line, or a day file, is removed.
The fleet of the day (0.31.0). Each sample also writes, for every aircraft in the decoder's list, a line to fleet-YYYY-MM-DD: its address, callsign, barometric altitude in feet and type code, tab-separated. One line per aircraft and per day: a later sample updates the altitude, and a blank never replaces what an earlier sample knew (the callsign often comes after the first position). No position is written. Since 0.36.0, two more columns: the emitter category the aircraft sends (A1 light, A7 rotorcraft, B1 glider, B6 drone…) and a military mark, from the decoder's database (dbFlags) or tar1090's (its entry's first flag); a line of 0.31.0, four columns, is read as before. 0.37.0 adds the time last seen (HHMM), so that the page's last 24 hours count yesterday's aircraft from the same time on. The type is in the decoder's list only when it loads an aircraft database; otherwise, when data localdb on is set, the sample looks each aircraft new to the day up once in tar1090's database (a few dozen addresses a quarter hour, each of the database's files read once, the wall's own caches left alone). Without either, the types list says so; aircraft sampled before localdb on keep no type. With the address file, about 30 KB a day on the card; kept thirty days like the rest, emptied by stats clear.
What the wall could not name or draw (0.21.0). Each sample also asks the wall, on the loopback, which aircraft are inside its radius (the radius the wall shows, in its own units: until 0.99.13 the number was sent as kilometres, so a radius in miles or nautical miles was sampled smaller, 10 mi as 10 km), and notes once per aircraft the callsign prefixes shown without an airline name and the type codes drawn with the generic silhouette, in gaps-YYYY-MM-DD files kept thirty days. zenithboard stats gaps prints the counts; what they are for is on the Roadmap.
Which aircraft was the farthest (0.22.0). The decoder's stats.json says how far the farthest aircraft was, never which one. So, while statistics are on, the wall server looks at aircraft.json every five seconds and keeps in memory, for today and yesterday, the aircraft whose position was the farthest from the antenna (a position under thirty seconds old, in the air, a real ICAO address, and under 600 km: readsb's own limit is 556 km, beyond is a decoding error). Each sample asks the wall for it on the loopback and writes it to farthest-YYYY-MM-DD, one JSON object, thirty days like the rest. A farther record already written (before the wall restarted, say) is never replaced by a nearer one. What is written: the date and time, the callsign and the flight number, the airline, the registration and model, the altitude, the distance, the route when the route lookup is on and can believe it (the same check as on the wall), and the city of 100 000 inhabitants or more nearest the aircraft with its distance. Neither the aircraft's position nor the antenna's is written or shown. When a route is still being looked up, the sample waits a few seconds for it.
The cities come from GeoNames (Creative Commons Attribution 4.0), shipped as flightinfo/data/cities100k.tsv and made by tools/make_cities.py: 4 578 cities, the population being the city's own. The districts GeoNames lists as places of their own (the Paris arrondissements, Neukölln) are left out, and so are two British entries that carry a district's population (checked: St Peter's in Kent, Mendip). Nothing is looked up over the internet for a city.
Two measures feed the farthest: the decoder's own maximum over each fifteen minutes (the CSV), and the farthest position the wall saw, every five seconds (the day's line, written down once a day). They can differ by far more than a few kilometres: on the owner's week of 24–30 October 2026 the decoder's best was 183 NM, the wall's 262 NM (SQ308 near Groningen, 25 October). Since 0.99.4 the box, the chart and the table take the larger of the two for each day or hour, so the box and the line agree; before, the box showed the decoder's figure alone. Days before 0.22.0 have a box and no line; the page says so for the thirty-day best.
At the edge of range the decoder often has an aircraft's positions before its callsign. Since 0.24.0 the wall remembers the callsigns heard in the last hour and names the farthest aircraft with the one heard before or after its farthest position; until then the line had the registration and the model alone, with no flight and no route (seen on the real page: TF-ICE · BOEING 737 MAX 8 · 322 km).
The daily aircraft count is a floor, now close to the real one (0.54.18). Until 0.54.17 a sample every fifteen minutes missed every aircraft that crossed in less than that: the owner's FlightAware page gave 2 878 aircraft on 23 October 2026 where /stats gave 2 554, 11% fewer, every day of the week alike. Since 0.54.18 the wall, which already reads aircraft.json every five seconds for the farthest aircraft, notes every address of the day in memory (with its callsign, altitude, type, category, military mark and time last seen), and the quarter-hour sample adds them to the day's files: nothing more is written to the card, and nothing more often. The wall answers that list on the loopback only (/api/seen). Without the wall (statistics on without it), the quarter-hour look alone counts, as before.
FlightAware's Aircraft reported also counts what it calls Other: about 40 to 110 a day here, part of them non-ICAO addresses (TIS-B, marked ~ by the decoder) that ZenithBoard never counts, since they are made up. A few percent below FlightAware is therefore expected.
The 7 and 30 days count distinct aircraft over the whole period: an aircraft seen on four days counts once. Checked by hand on 24–30 October 2026: 6 855 distinct aircraft (sort -u of the seven day files) for 16 994 aircraft-days (the same files added up). The owner's 18–24 October week: 6 673 distinct aircraft on /stats (6 613 on the weekly post, made two hours earlier), against about 2 600 a day. FlightAware's table gives one figure per day; adding its seven days counts the same Ryanair 737 seven times. Since 0.99.24 the box says both, because the owner read the one as the other on 10 November 2026 (2 000 a day times 7 is never 6 600): different aircraft, each counted once for the big figure, and under it the period's days added up, as FlightAware counts (each day's file, the days' sum). His own days of 16–20 October: 13 097 added up, 6 186 different. The 24 hours keep their one figure.
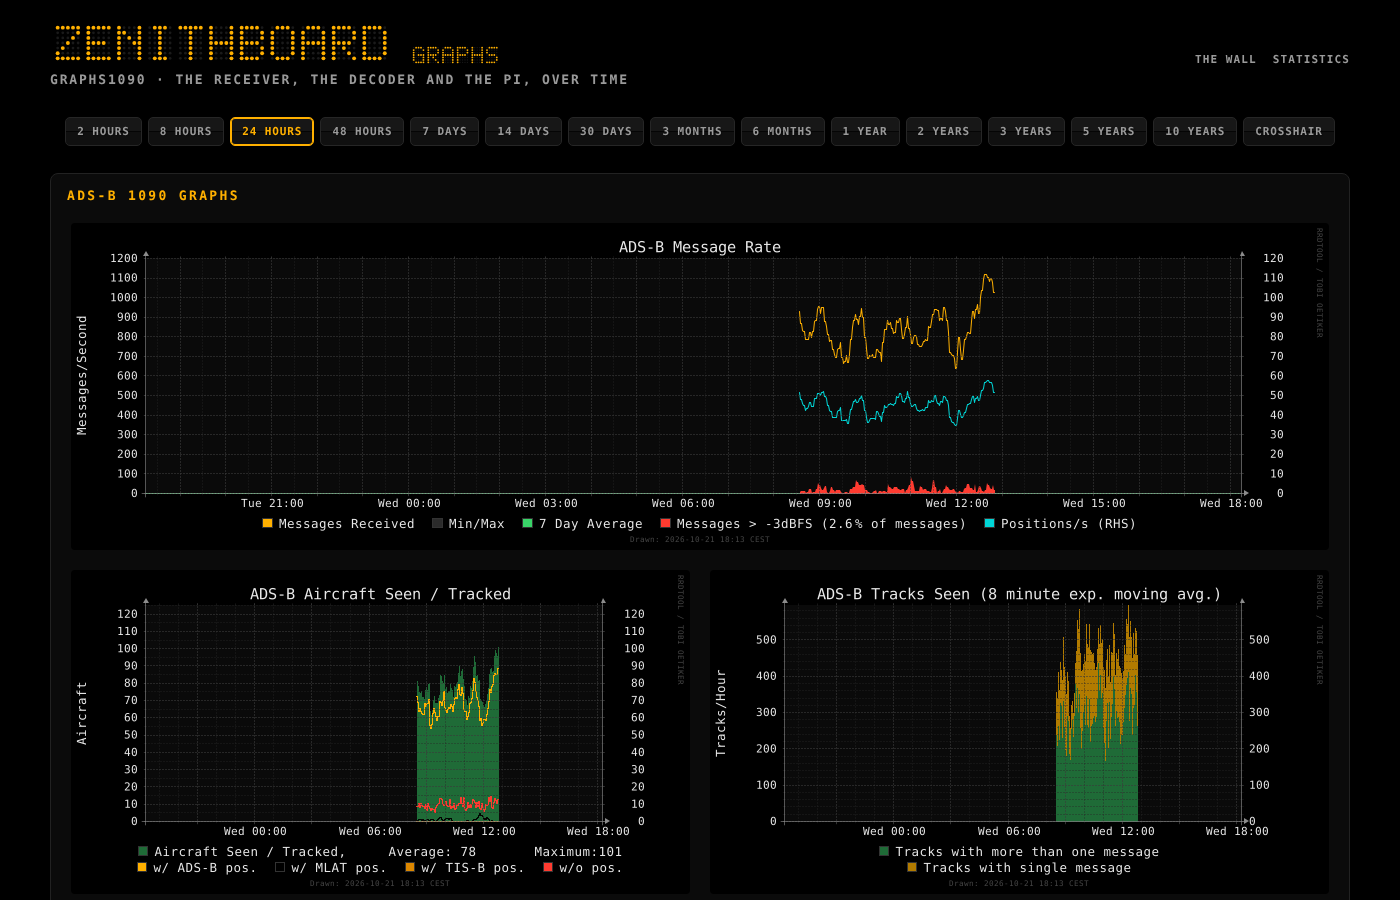
The /stats page keeps thirty days of what ZenithBoard measures. For the long view of the decoder itself — messages, range, signal and noise, aircraft, CPU, temperature, over days, months and years — there is graphs1090, by the author of readsb and tar1090. Off by default (0.32.0):
sudo zenithboard graphs on        # menu 7 Options -> 2 graphs1090
zenithboard graphs status
sudo zenithboard graphs off
What on does. It checks that a decoder is installed, that lighttpd is there (it comes with the receiver map: tar1090, or FlightAware's SkyAware) and that 64 MB are free in /run, then runs graphs1090's own installer, the way readsb is installed. Read in full on 20 October 2026, that installer: installs collectd-core, rrdtool, git, wget, unzip and bash-builtins from apt (signed); copies itself to /usr/share/graphs1090; replaces /etc/collectd/collectd.conf (keeping the old one as collectd.conf.graphs1090); adds two lighttpd files, /graphs1090 on port 80 and its own port 8542; and keeps the graphs' data in memory, in /run/collectd, writing it to the card once a day at 23:42 and at shutdown — so unplugging the Pi without sudo shutdown now loses up to a day of graphs. It also changes one line of Flightradar24's updater script when that is installed (a fix its author ships for a read-only remount). ZenithBoard notes which packages were not there before, in /etc/zenithboard/graphs1090.state.
What off does. It runs graphs1090's uninstaller, which stops collectd (writing the graphs to the card) and puts the old collectd settings back; then removes what that uninstaller leaves behind (the two lighttpd files, its unit, /etc/default/graphs1090, its cron line) and restarts lighttpd; then removes the packages on added, and only those. apt is asked first: if something installed since needs one of them, they all stay and off says so. They are removed, never purged — Debian's purge of collectd-core deletes /var/lib/collectd, the history — so the history stays on the card for a later on, and off gives the command to delete it.
sudo zenithboard update runs graphs1090's installer again while it is on (it stops at once when nothing changed), and Uninstall everything turns it off. zenithboard security names port 8542; like the receiver map, lighttpd answers anyone who reaches it.
Not yet run on the reference Pi. The installer was read, not run, in the session that wrote this: what it costs on a Pi 3B (memory for collectd, the size in /run) is for zenithboard graphs status to say, and the field log to keep.
In ZenithBoard's own look since 0.37.0: the name in the wall's dots, numbers and bars in the wall's colour (amber, or the colour the wall is set to) on black, grey for what explains them. Top right, the period: 24 h, 7 days or 30 days. Everything on the page follows it (0.43.0: the sky by hour, the fourth box and the farthest aircraft did not); the choice stays in the address (/stats#7d) and, when the browser allows it, for the next visit. From the top, in the order of the summary's posts (the owner, 21 October 2026):
- Four boxes: distinct aircraft (a floor; over 7 and 30 days with the days added up under it, 0.99.24), messages with the busiest hour (since 0.99.4 the messages of that hour in one day, on average over the period's days: before, 7 and 30 days added that hour up over every day and 18:00, 19 587 531 read like a single hour; from ten million on, shortened to 386.5 M the language's way, the whole number in its tooltip, 0.54.18), the farthest distance and when (the start of its quarter hour since 0.99.22: at 23:45 for the line of 00:00), and the busiest day (7 and 30 days: the most distinct aircraft) or busiest hour (24 hours: the most aircraft with a position, on average).
- The farthest aircraft of the period, in words, its airline's flag first. One aircraft is written down a day, the day's farthest (since 0.22.0): for 24 hours, yesterday's counts when it was seen inside them: the 24 hourly slots the box and the chart show, from the top of the hour 23 hours back (at 14:20, from 15:00 yesterday; the same start for the box, the chart and the line since 0.99.15). When the box above says more, the line says why, with the box's distance in the page's unit (since 0.99.15: before, in kilometres whatever the unit).
- Aircraft (the first post): the sky by hour for the period — one row of the 24 hours, or a row a day for 7 or 30 — then the airlines and the models most seen side by side.
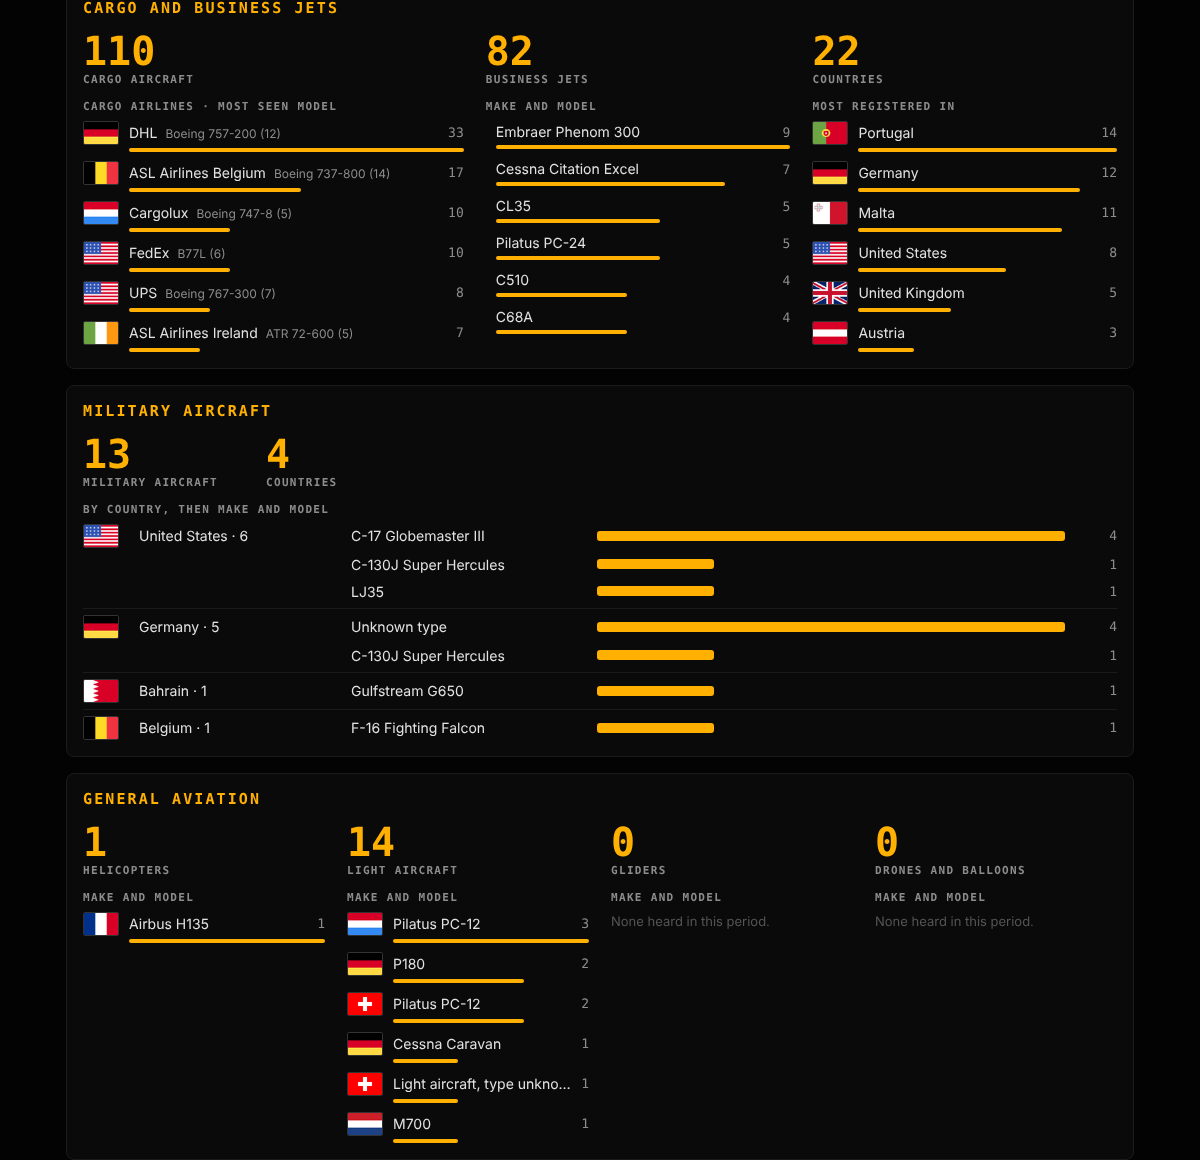
- Cargo and business jets (the second post): each cargo airline with the model it flew most, the business jets by make and model, the countries they are most registered in.
- Military aircraft (the third post): by country, then make and model. General aviation (the fourth): helicopters, light aircraft, gliders, drones and balloons, a row per model and country.
- Then how high (bands of 1 km or 5 000 ft), the messages, and the rest: the farthest aircraft and the aircraft by hour or by day, and the table. An hour or a day with no sample is a gap in the line, never a zero.
- Units (0.55.0): the page follows the wall's units. The distances (the farthest box, the farthest line and its city, the chart and the table) in km, in miles (imperial) or in nautical miles (aviation); the altitudes in metres or feet. Before 0.55.0 the distances were in km whatever the units. The files keep km.
Every airline starts with its flag (0.43.0), passenger or cargo, the column of flags aligned: the country the airline is based in, from the airline and cargo lists ZenithBoard carries (each code checked against a published source: flightinfo/data), or the one adsbdb gave when it named an airline those lists do not know; else the country most of its aircraft heard are registered in (their address). A name made of several prefixes takes the most heard: DHL (EAT Leipzig, DHL Air UK, DHL Air Austria…) shows Germany on the reference Pi. The same flags on the summary's first and second cards.
A tooltip on each bar, dot and point, and the period's numbers as a table underneath. Readable on a phone: the drawings are sized to the screen and the military rows fold (their bar left out, since 0.99.20 as intended), and a tooltip stays inside the screen at a chart's edges and goes away when the page scrolls (0.99.20). On a tablet the boxes' figures shrink a little (34 px down to 22 px) rather than being cut. Nothing is asked of the internet; the flags are files on the Pi, served at /flags/XX.png.
What it costs the Pi. Each period is worked out on demand and kept until a statistics file changes (at most every quarter hour): three periods, three answers in memory. Thirty days of made-up statistics (12 700 aircraft) took 0.14 s on a desk machine; on a Pi 3B, about ten times that, once a quarter hour for each period somebody looks at.
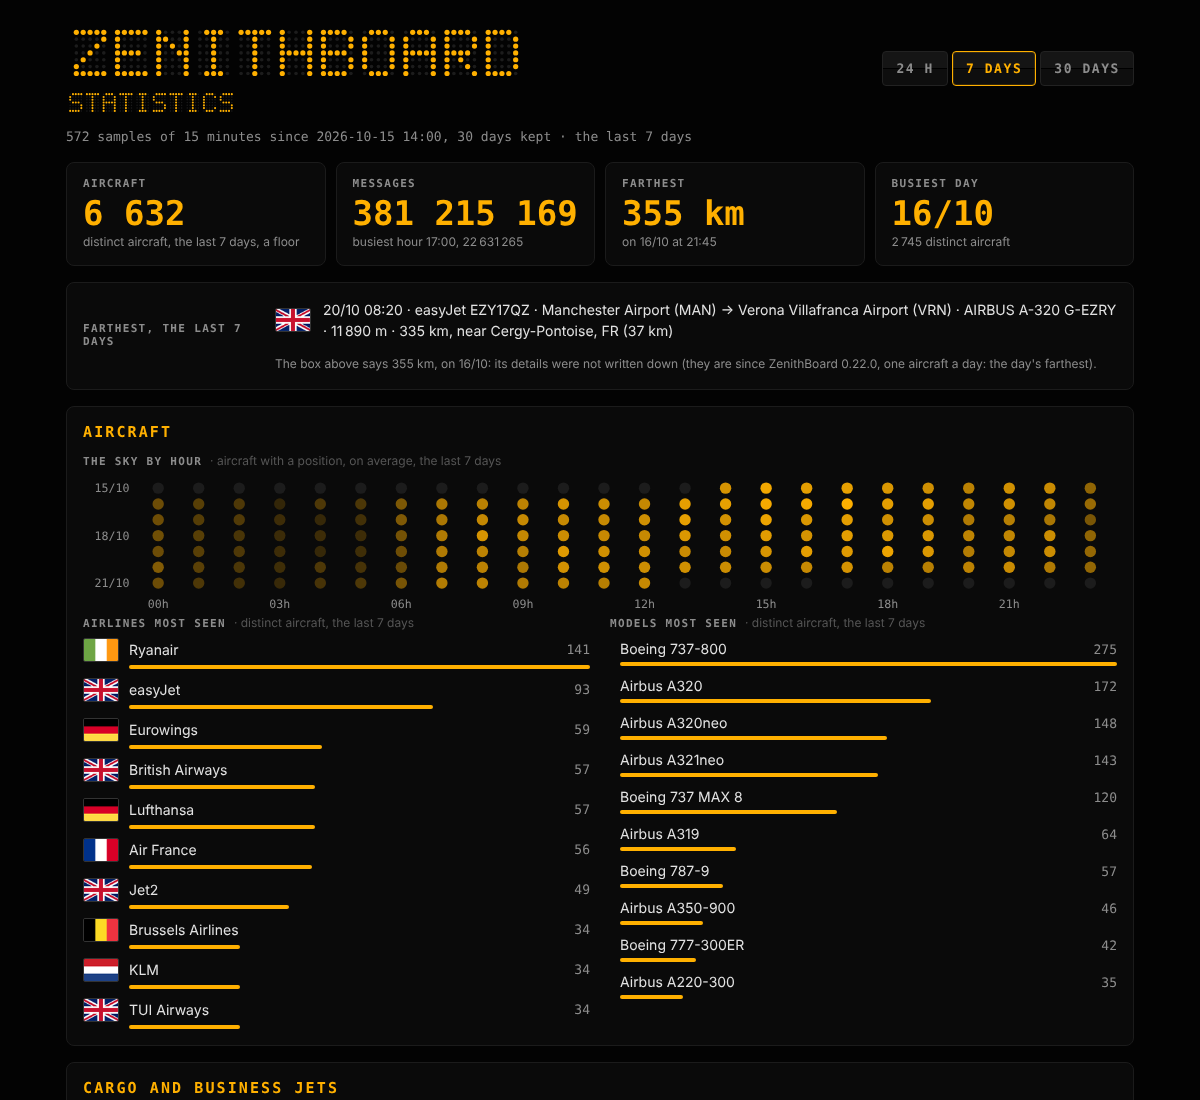
The line leaves out what is not known rather than guess it: no airline, no route, no city each drop their part. A city within 50 km reads near Lyon, FR (12 km); farther, over the sea or open country, 85 km from Brugge, BE. Altitude follows the wall's units; distances are in km, like the rest of the page.
With statistics off, the page says so and how to turn them on. /api/stats?range=24h|7d|30d answers the same numbers as JSON (30 days when the range is left out), {"enabled": false} when off. /api/farthest is what the sample asks: the records the wall holds in memory for today and yesterday.
sudo zenithboard graphs look original        # graphs1090's own look (menu 7 Options → 2 graphs1090 → 2, or the console's Receiver section)
sudo zenithboard graphs look zenithboard     # ZenithBoard's look again
Since 0.44.0, when graphs1090 is on it is in ZenithBoard's look unless you chose original (the owner: "as default,
just a command to disable it"); an update puts it on a Pi that had never chosen.
graphs1090's page on port 8542 in the statistics page's look: black, the wall's colour, the name in the wall's dots with links to the wall and /stats, the period buttons and panels styled like the statistics page; on a phone, one graph a row, the width of the screen, and the name in dots no wider than the screen (0.99.20: at 320 px it went past the edge). The graphs themselves are drawn in the same colours: graphs1090 draws them with rrdtool and reads its colours from /etc/default/graphs1090 after its own colour schemes, so ZenithBoard writes a marked block at the end of that file — a black canvas, light grey text and grid, the wall's colour for the main series (messages received, aircraft with a position), its shades and the wall's turquoise, green and red where a graph needs more series told apart. Checked against every graph of the reference Pi's own history (its backup of 21 October 2026): each line and its legend still read.
What it changes, and original takes away: the block in /etc/default/graphs1090; six lines in graphs1090's index.html (two stylesheets, zenithboard.css and i18n.css; four scripts: zb-lang.js just before graphs1090's own graphs.js, then font5x7.js, i18n.js and zenithboard.js after it); those six files beside it, and the languages' catalogues in zb-i18n/. zb-lang.js comes first because graphs1090's script puts ?timeframe= in the address as it starts: it keeps a ?lang= (a link from the wall or /stats in French opens the page in French) that was lost before 0.99.20. graphs1090's own files are otherwise left alone, its credit and version at the foot included. Its updates write its page again: zenithboard update puts the look back after them, and so does a new wall colour. graphs1090 must be on first.
$ zenithboard stats
Statistics: on, 2785 samples of 15 minutes, 30 days kept    File: /var/lib/zenithboard/stats/stats.csv

Today        201 aircraft seen     17558 messages   farthest 329 km
Yesterday    338 aircraft seen     37090 messages   farthest 334 km
Average      326 aircraft/day on average over 28 complete days   best 335 km on 2026-10-02

Messages per hour today, 00 to 23
 ▁▁▁▁▁▃▃█▇▇▆▆▆▆▂▁▁▁▁▁▁▁▁▁
zenithboard stats csv prints the raw samples; zenithboard stats status the state and the next run; sudo zenithboard stats clear empties the files; sudo zenithboard stats off stops the timer and keeps them.
What the lines count (0.99.13). Today and Yesterday are each day's file of distinct aircraft (seen-YYYY-MM-DD), the figure /stats shows: until 0.99.12 Yesterday and the average took the count of the day's last sample in the CSV, which left out the aircraft the wall added after it (its five-second look, and the sample just after midnight that writes the day before's last aircraft). The average covers complete days only, days before today sampled from their first hour (00) to their last (23), and says how many: today, and a day the timer was on for part of, would pull it down. Before the first complete day it says no complete day yet. The best distance is over every day kept.
Without sudo (0.99.13). The files are readable by every user of the Pi (644, the folder 755): they hold no position, only counts, aircraft addresses and callsigns and the farthest aircraft's nearest city, which /stats shows anyway. Until 0.99.12 the timer's unit wrote them 0600 (UMask=0077), so zenithboard stats without sudo read nothing and said 0 samples; the unit now says UMask=0022, and the files written before are made readable at the next sample or update, each opened without following a link. When a file still cannot be read, stats, stats csv, stats gaps and stats status say so and give the command with sudo, instead of a zero.
sudo zenithboard stats off disables the timer and removes its unit files. The CSV and the day files stay where they are until stats clear. Nothing else in ZenithBoard reads them.
At the foot of the page, in grey, the version the server is running, linked to that version's release notes on GitHub. The line is drawn from /api/stats, which carries the version whether statistics are on or off; GitHub is asked for nothing unless somebody follows the link. It is there so a screenshot of the page says which code drew it.