Repository navigation
Storage and Machine Screens
Documentation snapshot from README.md at commit
20d7c81. Check the current source for updates.
The illustrated ports and shared-disk guide shows the dashboard tabs, readiness, and the containers sharing each backing volume.
Machines that have a door open it. Inside are the pod's volumes as drawers. Pick one to browse it: folders, sizes, owners, and a preview of any file as text or hex, 64 KiB at a time.
It is read-only and it stays inside the volume: no .., no following a
symlinked folder out, and Secret and service-account volumes are never read.
It uses the container's own ls and head, so an image without them
(distroless) says "unsupported" rather than guessing. It never starts a helper
pod and never mounts anything. A neighbouring machine in the way stops the door.
Every machine has a screen, and it can show four things:
| View | What it shows |
|---|---|
| Dashboard | the application's own page through LiveView, a Grafana or Tautulli provider, or in a demo world the simulated dashboard |
| Metrics | what the pod is using, as graphs: CPU, memory, network and disk I/O, then its state and each container |
| Logs | the end of its log, refreshed while it is up |
| Storage | what is mounted into it |
-
Rwhile looking at a machine steps its screen to the next view. -
Click the screen (or press
Von the machine) to open it full size, switch views there, and jump on to the full log, the file browser or the live page. - Metrics, logs and storage are the cluster's own data (or the simulation's,
marked as such), never made up. Usage figures come from the cluster's
metrics API (CPU and memory; it needs metrics-server) or from
docker stats(all four). A figure the source does not report shows as unavailable with the reason, not as 0. - A screen is for reading: no tool acts through it, whatever you are holding.
- Beside each machine's name is an icon for what it runs: database, cache, media server, proxy, monitoring and so on, chosen from the container image.
- The text under the crosshair now sits below the screen you are reading, and floating name labels show only from across the yard.
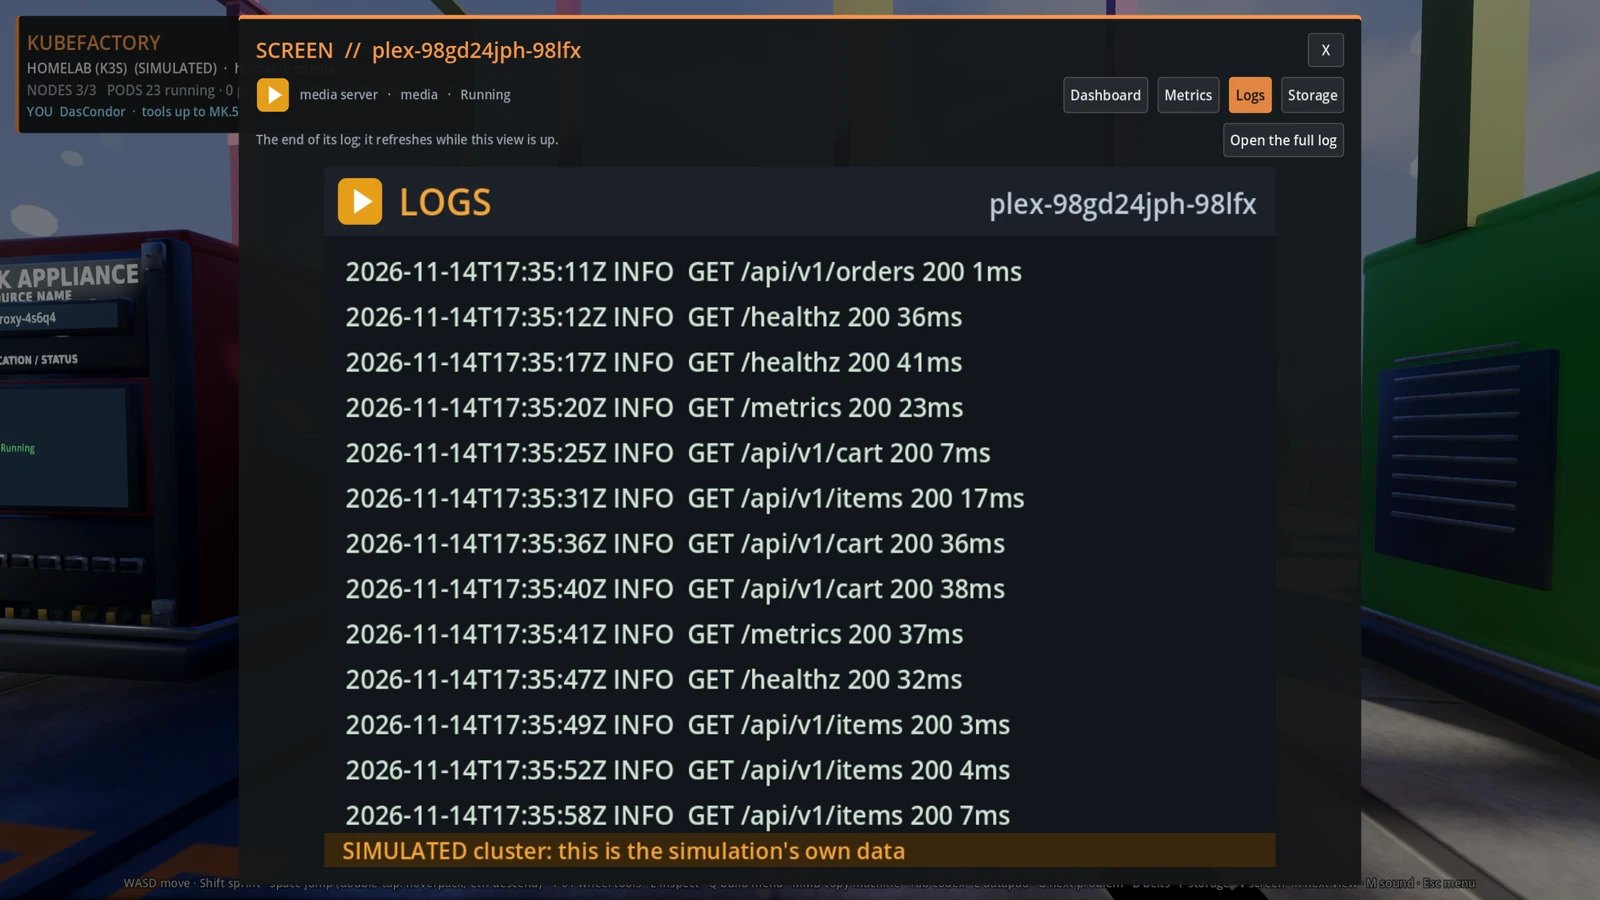
Click a screen to open it full size and switch views there.
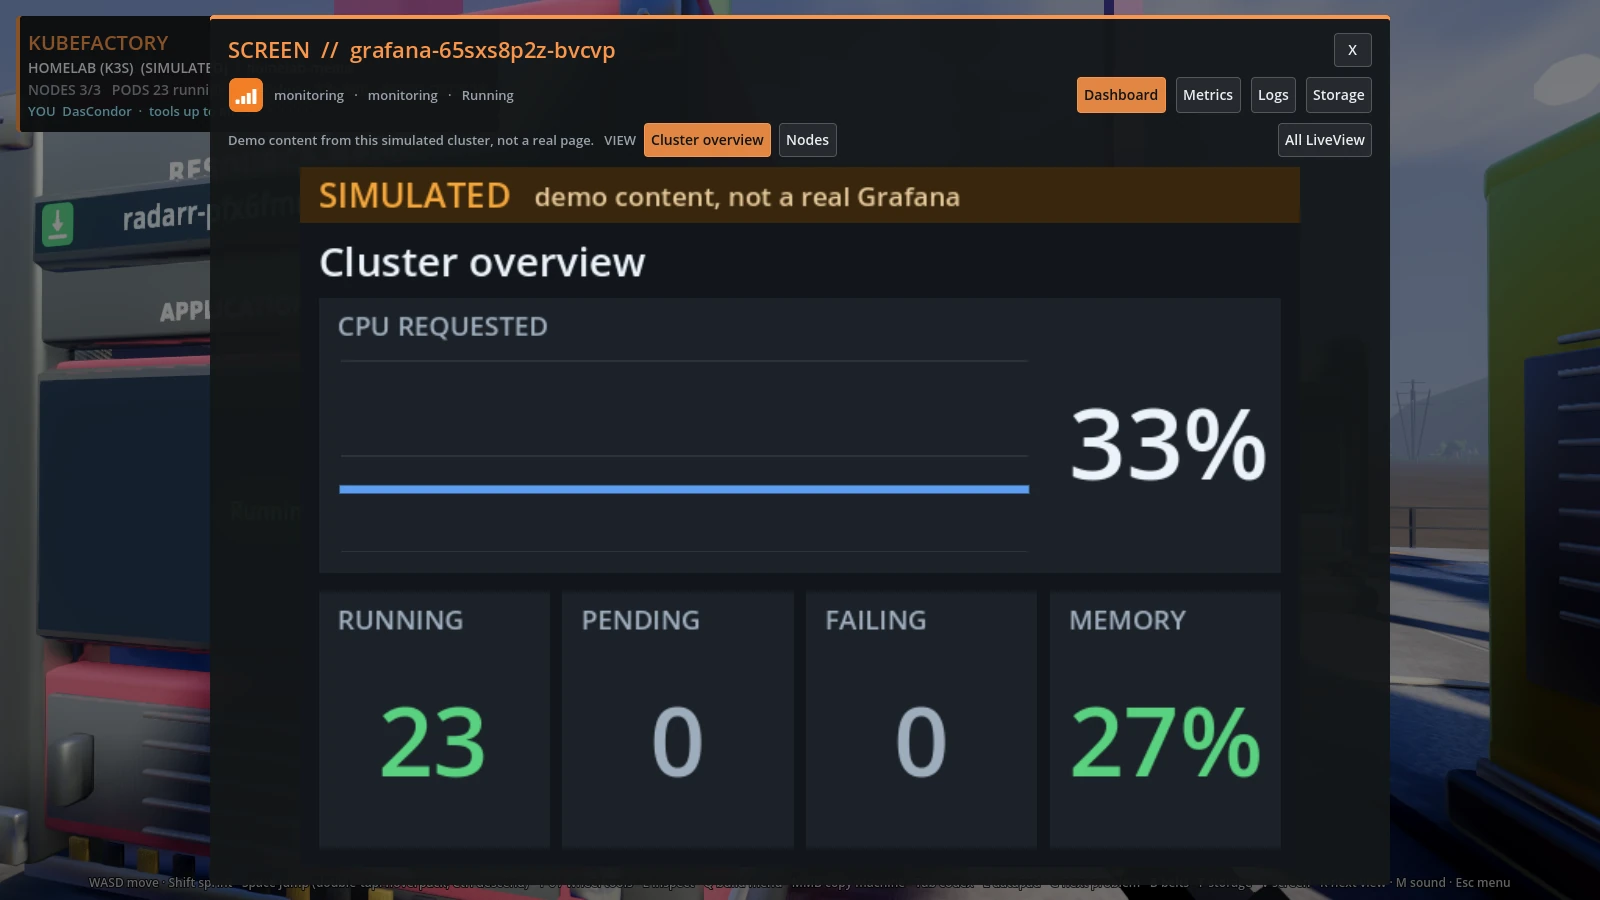
In the demo worlds, Grafana and media screens show simulated content, marked as such.
Meet Gauge beside the logging station, or open Gauge from the pause menu. Gauge shows node capacity and the requests of visible regular containers, then reads a selected workload's CPU and memory usage on demand. Docker and the simulation also report cumulative network and disk totals. Missing metrics are shown as unavailable, and demo figures are marked SIMULATED. Gauge is read-only and makes no changes; use sustained measurements and workload context before adjusting resource settings. You can hide Gauge in the world from the pause menu.
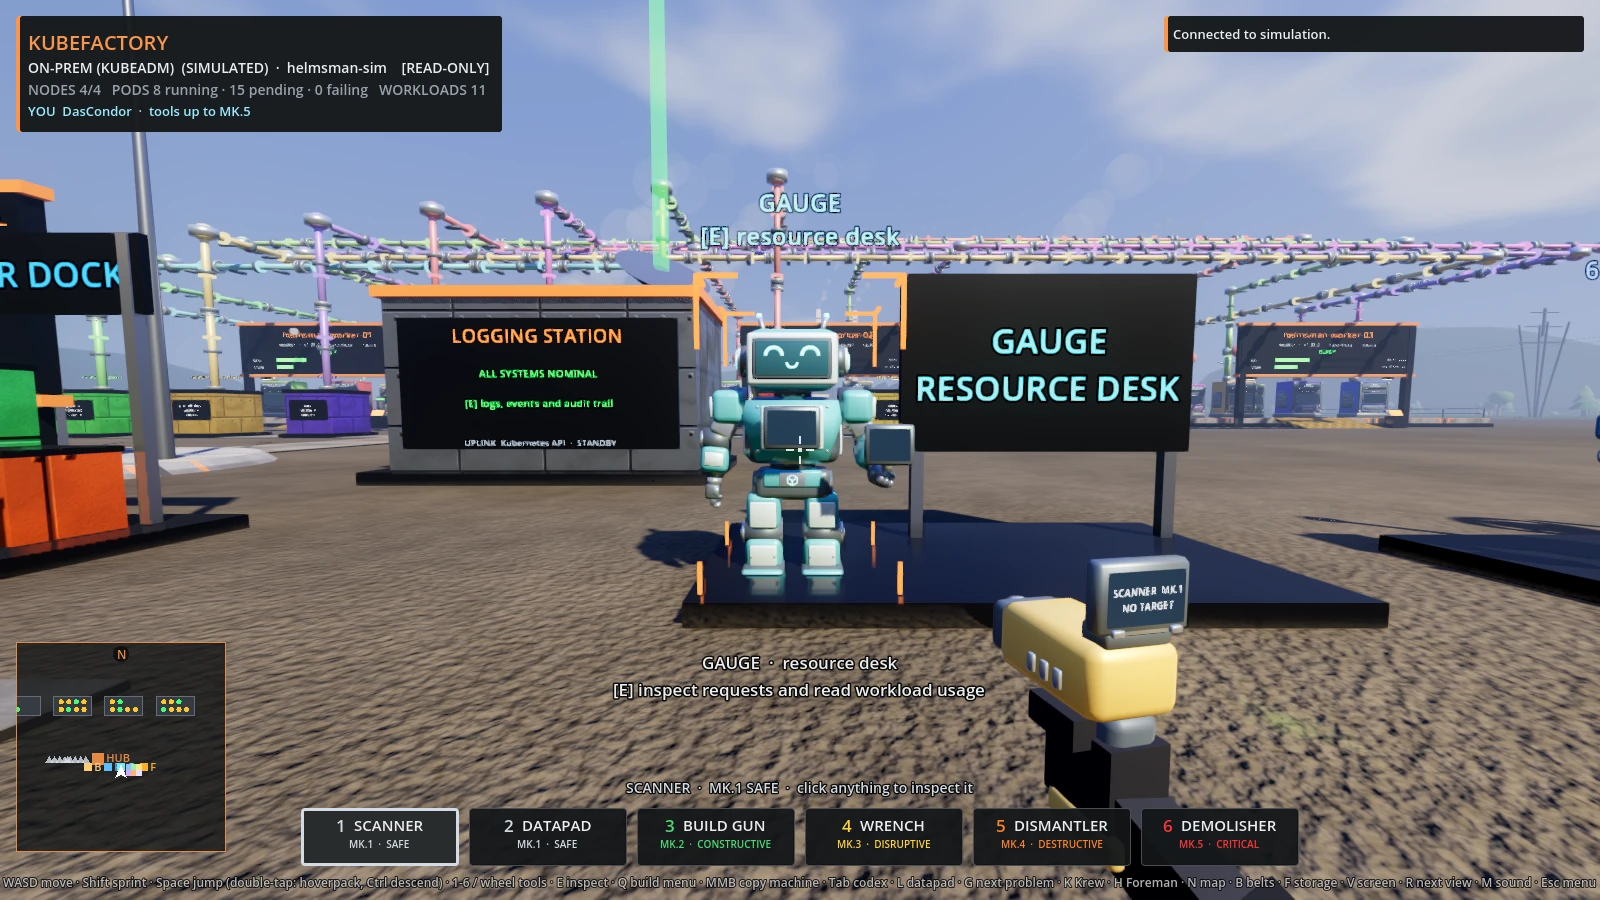
Gauge at the resource desk.
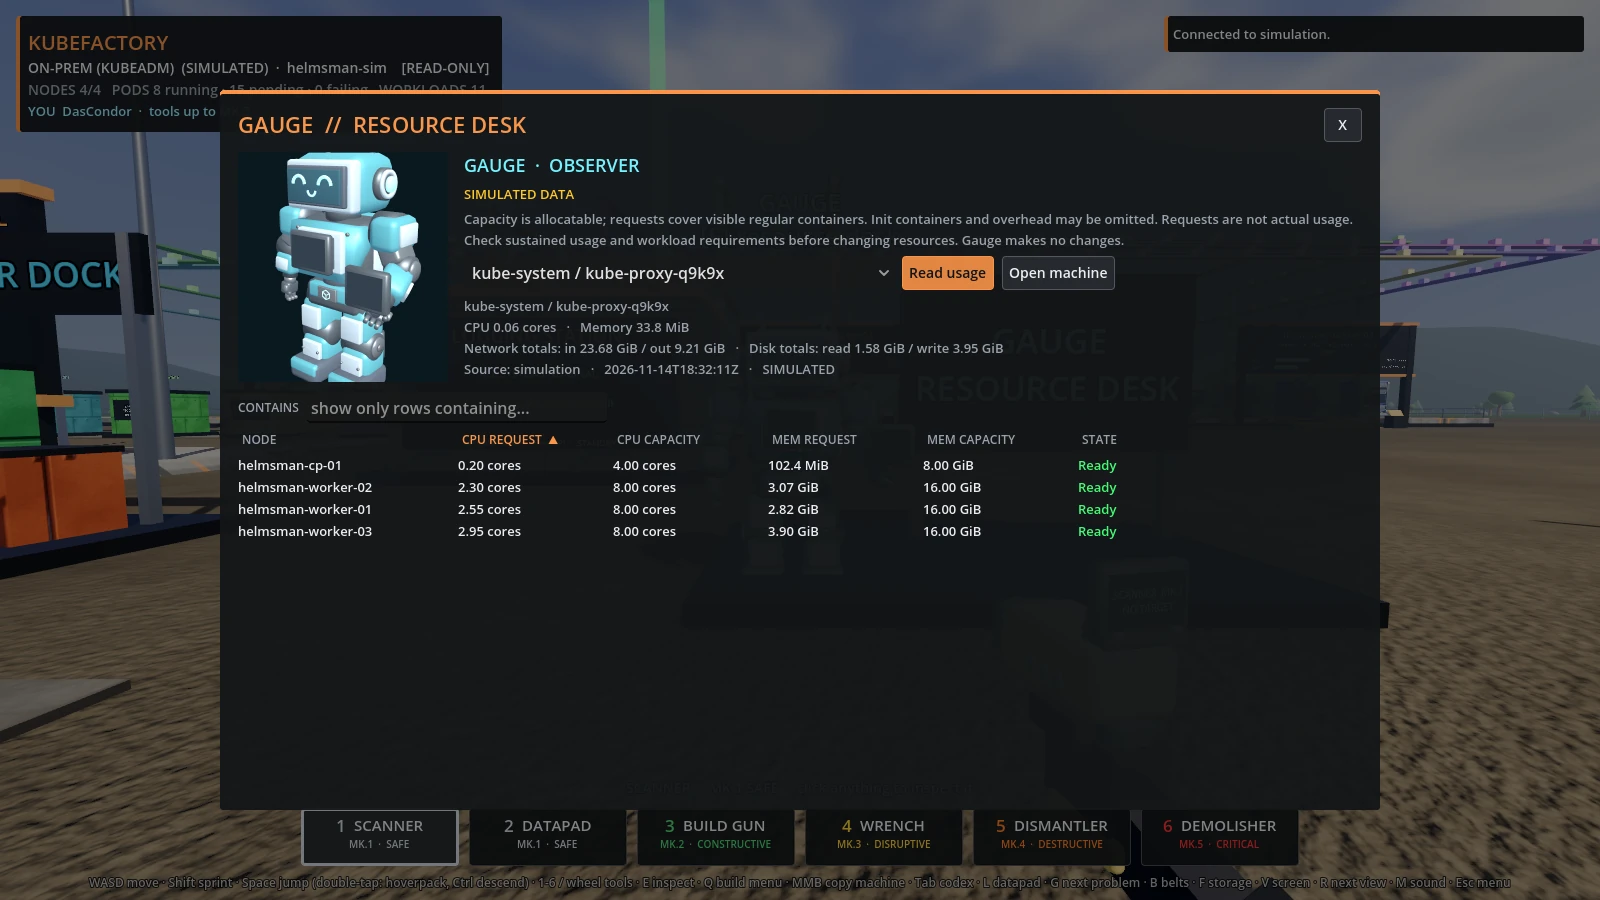
Gauge's read-only resource panel.
Lists with columns (workloads, clusters, files in a volume, Grafana dashboards and panels) have a CONTAINS box and clickable headings: click once to sort, again to reverse, a third time to go back to the original order. Sorting and filtering work on tables with fewer than 10,000 rows.