Repository navigation
How aiphoria works
This page gives the big picture. The next pages explain each idea in more detail: Processes, flows and stocks, Indicators, and Scenarios and scenario modes.
You describe a system of processes (for example sawmilling, construction, incineration) connected by flows of material. Some flows are known amounts (absolute flows), others are shares of what leaves a process (relative flows). For every year, aiphoria calculates all flows so that what goes into each process also comes out of it (mass balance). Some processes keep material for years: these are stocks (for example wood in buildings). aiphoria uses ODYM's dynamic stock model to follow how much material enters and leaves each stock over time. Extra quantities such as carbon are carried along with the flows as indicators. Finally, you can create alternative scenarios by changing selected flows over time and compare them with the baseline.
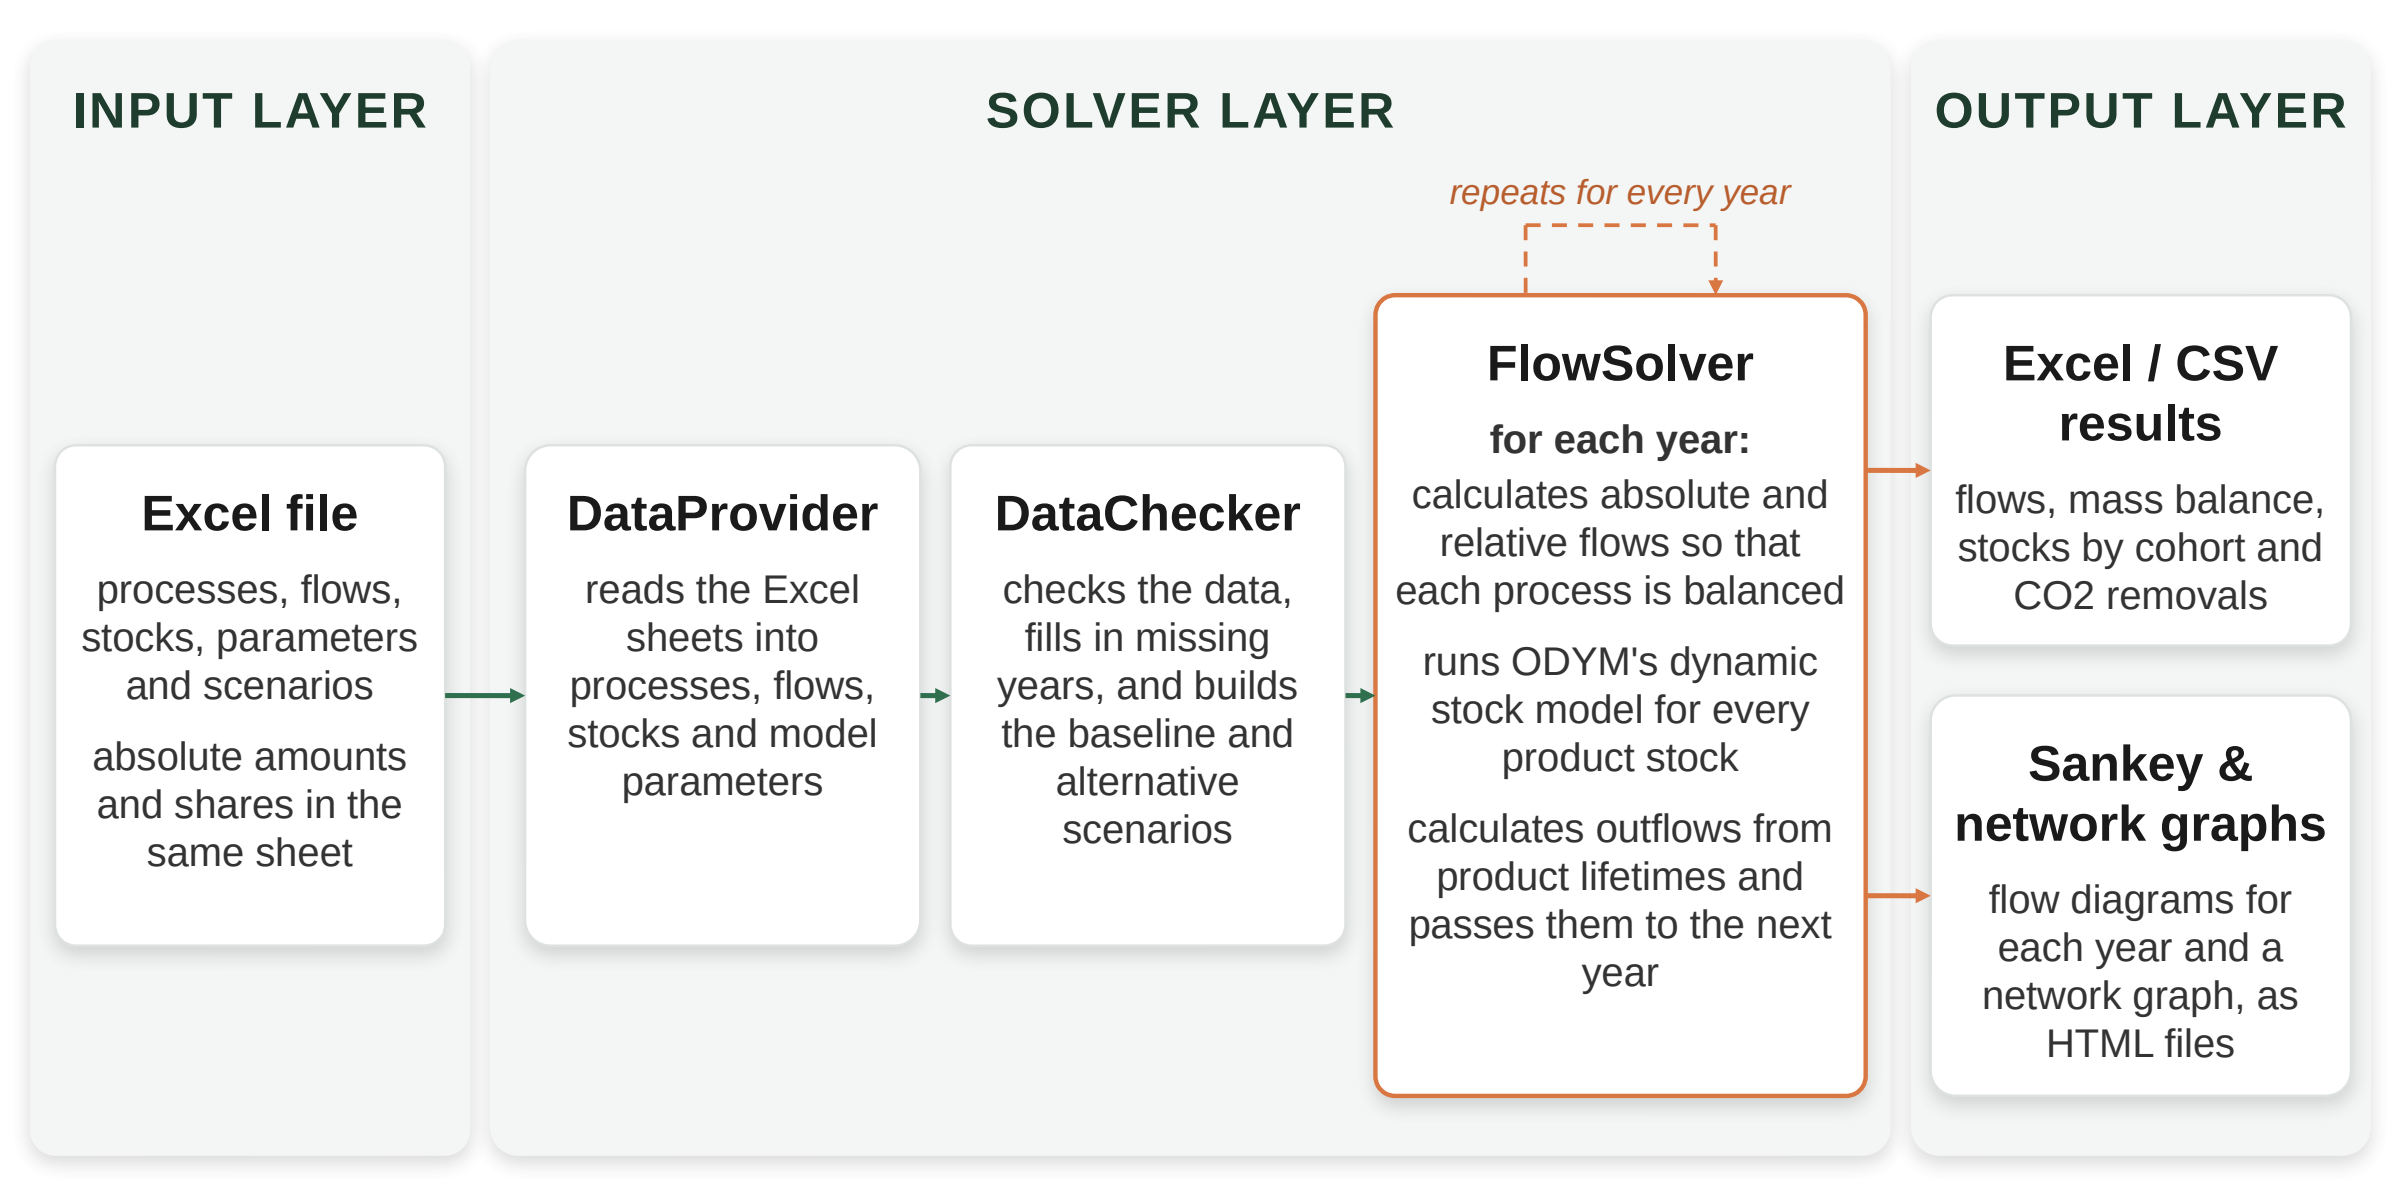
| Layer | What happens | Main parts |
|---|---|---|
| Input | You describe the whole model in one Excel file | The scenario file |
| Solver | aiphoria reads and checks the data, builds the scenarios, and solves them year by year |
DataProvider, DataChecker, FlowSolver, ODYM DynamicStockModel
|
| Output | Results are written as Excel/CSV files and interactive HTML graphs | Output files, Interactive visualizations |
-
Read the Excel file: settings, processes, flows, scenarios (
DataProvider). -
Check the data and prepare it (
DataChecker):- check for errors (for example unknown process IDs or invalid stock parameters),
- detect the year range,
- fill in missing years (see
fill_methodin the Settings sheet), - build the baseline scenario and every alternative scenario.
-
Solve each scenario, one year at a time (
FlowSolver):- calculate absolute and relative flows so that every process is balanced,
- pass the flows into stocks to ODYM's dynamic stock model,
- calculate the stock outflows from the product lifetimes; they become flows again in the next year,
- calculate the indicator values (for example carbon) for every flow.
- Write the results: flows, stocks, carbon and CO2 results, Sankey diagrams, and network graphs.
The flow data in the Excel file is the baseline scenario. It is always solved first and saved in a folder called
Baseline.
Alternative scenarios are created while aiphoria runs: it copies the baseline, applies the changes you defined in the Scenarios sheet (for example "reduce sawmilling residues by 50% between 2025 and 2030"), and solves the result again. See Scenarios and scenario modes.
Each year is a separate flow system: only flows with the same year are solved together. You do not need to give data
for every year. aiphoria can fill in missing years automatically (see fill_missing_absolute_flows,
fill_missing_relative_flows, and fill_method in the Settings sheet). You can consider each year as a different timestep, in case a different time-explicit timestep is relevant for your model.
NOTE: check for flows carefully, in some cases, for example flows that represent trade flows will be repeated at every timestep/year if not defined in the input file for the specific timestep/year.
- aiphoria models one dimension only: time. Location, processing stage, and material or carbon content are properties of processes and flows, not separate dimensions. If you need results split along several dimensions at once (for example region × product), you have to model them as separate processes.
- aiphoria does not convert between units. The Unit column is a label; all absolute values must use the same baseline unit (see Indicators).