Repository navigation
Other sheets
These sheets are optional. Use them when you need them.

Use this sheet to change the lifetime of a stock during the simulation, for example when products are expected to
last longer in the future. Turn it on with use_stock_lifetime_overrides in the Settings sheet.
| Column | Name | Description |
|---|---|---|
| A | (ignored) | Free column for your own notes |
| B | Process ID | Stock process to change. Must match a process ID in the Processes sheet. |
| C | Lifetime | New lifetime in years (whole number; decimals are cut off) |
| D | Start year (included) | First year with the new lifetime |
| E | End year (included) | Last year with the new lifetime |
| F | stddev | Standard deviation, for Normal, LogNormal, and FoldedNormal
|
| G | shape | Shape, for Weibull
|
| H | scale | Scale, for Weibull
|
| I | condition |
Dry, Wet, or Managed, for LandfillDecayWood and LandfillDecayPaper
|
| J | Comment | Free text |
Fill in only the parameter columns that the stock's distribution type uses (see Processes sheet).
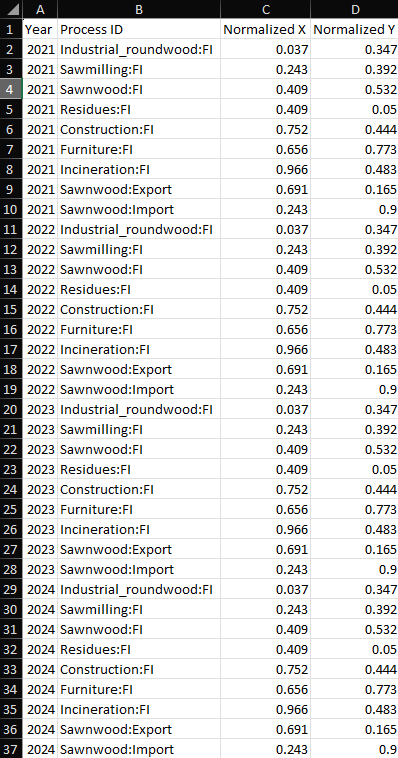
Use this sheet to fix where each process appears in the Sankey graph, for every year. Positions are normalized (from 0 to 1), so the layout works at any screen size.
| Column | Description |
|---|---|
| Year | Year of the position |
| Process ID | Process to place |
| Normalized X | Horizontal position (0 = left, 1 = right) |
| Normalized Y | Vertical position (0 = top, 1 = bottom) |
Positions in this sheet override the Normalized X/Y columns of the Processes sheet.
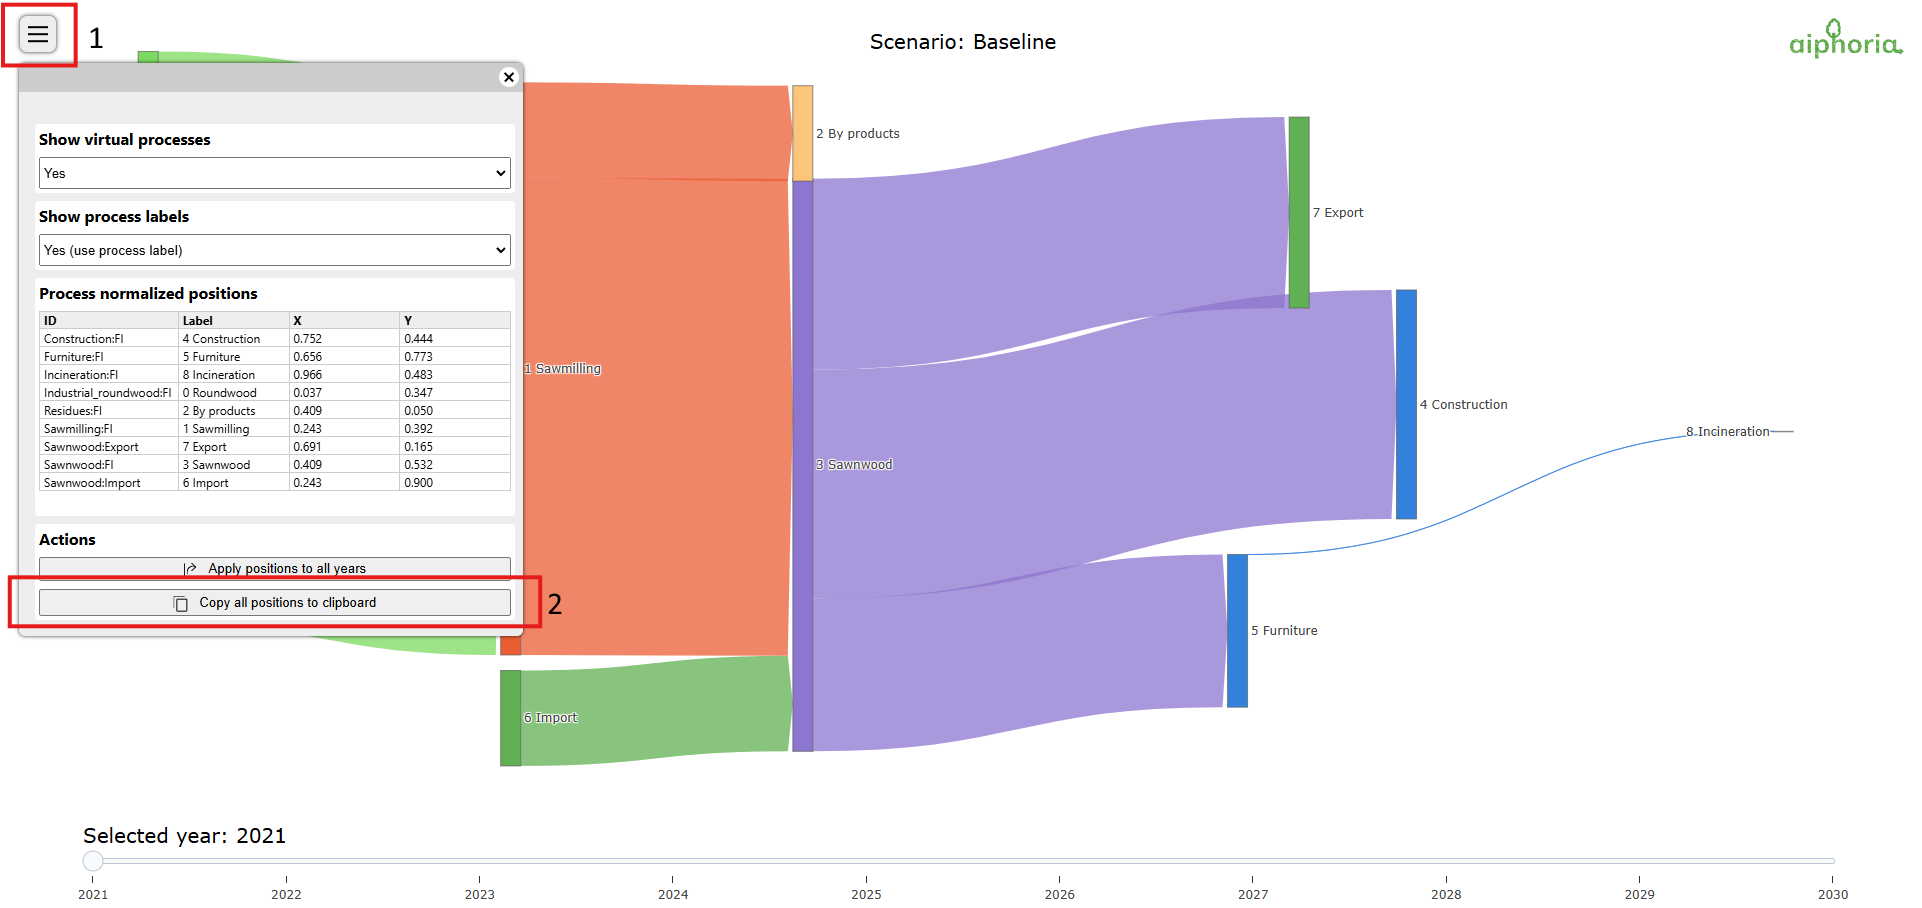
Tip: arrange processes in the graph, then copy the positions
- Open the Sankey graph, drag the processes where you want them.
- Open the Settings menu (top-left) and click Copy all positions to clipboard.
- Select cell A1 in the Process positions sheet and paste.
Use this sheet to set the colour of each transformation stage in the graphs.
| Column | Description |
|---|---|
| A | Transformation stage name (as in the Processes sheet) |
| B | Colour as a hex code, e.g. #7dda60
|
Stages without a colour get an automatic one. You can switch between your colours and automatic colours in the network graph (see Interactive visualizations).
Next: Output files