Repository navigation
Interactive visualizations
aiphoria creates two interactive graphs as HTML files. Open them in any web browser.
| Graph | Good for | File | Setting |
|---|---|---|---|
| Sankey graph | seeing how large the flows are, year by year, and comparing scenarios |
combined_sankey.html (all scenarios) |
create_sankey_charts |
| Network graph | seeing how the processes are connected |
<scenario>/network_graph.html (one per scenario) |
create_network_graphs |
Both graphs use the same keys to move through the years:
| Action | Key or button |
|---|---|
| Next year | Right arrow key, or the arrow at the right of the timeline |
| Previous year | Left arrow key, or the arrow at the left of the timeline |
| First year | Home key |
| Last year | End key |
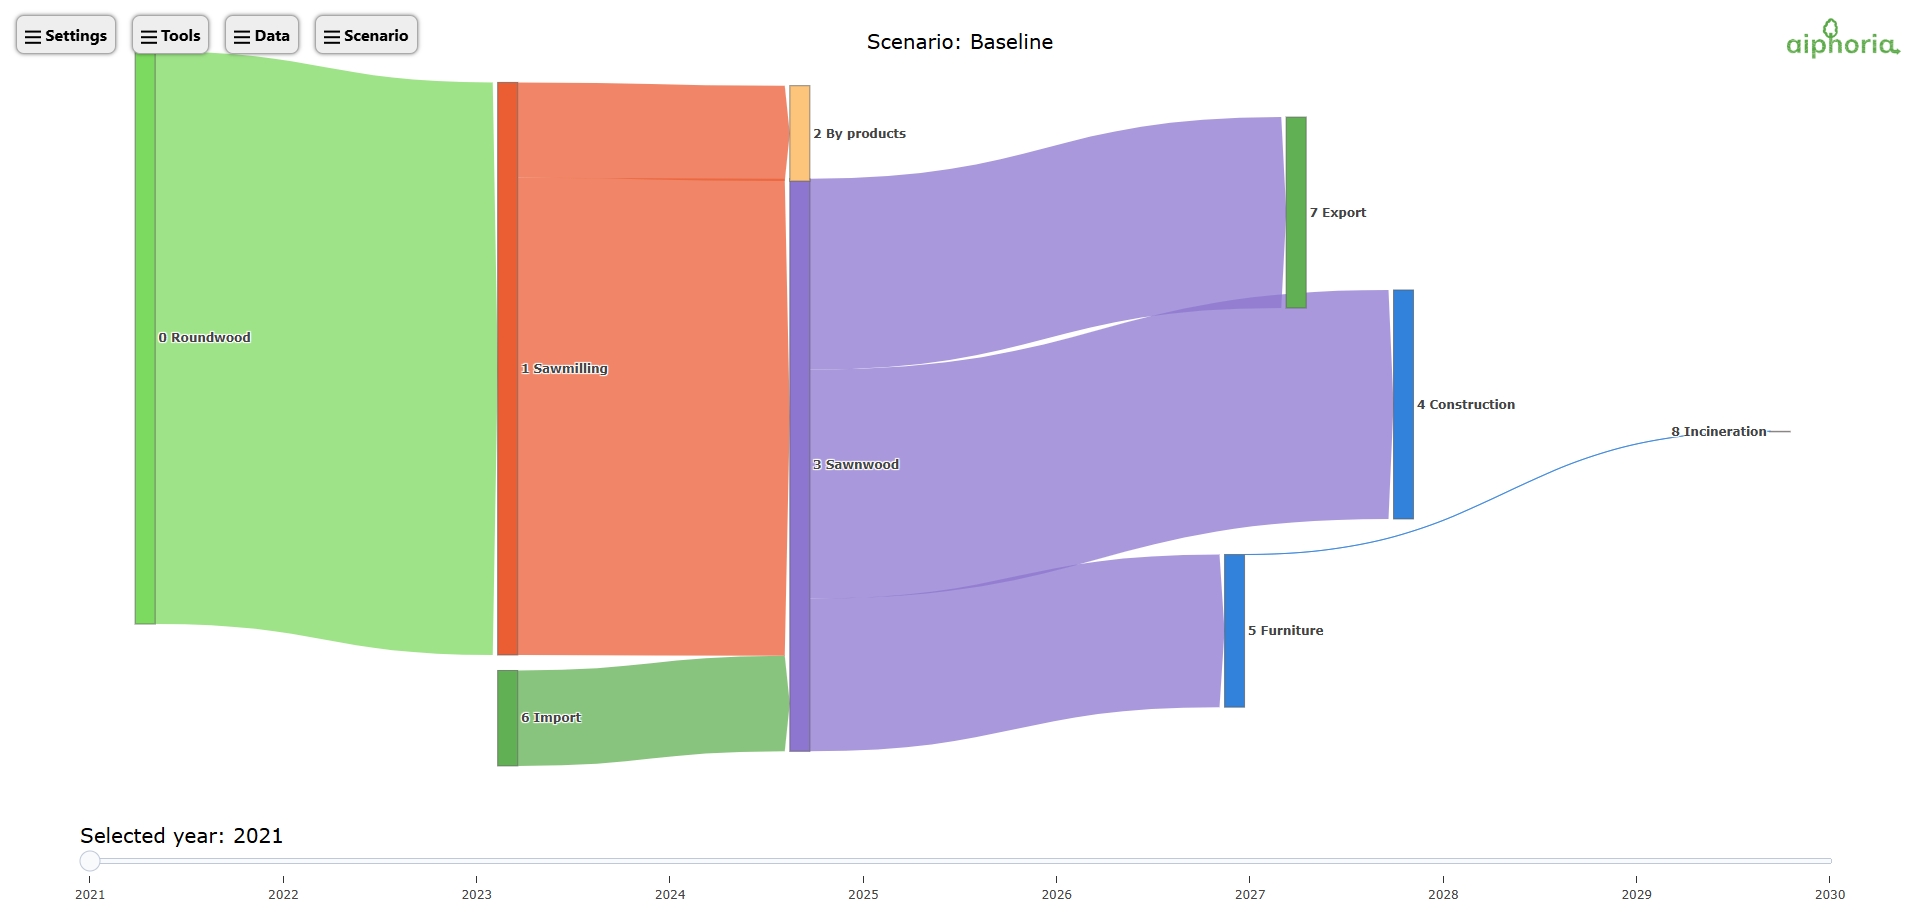
The Sankey graph contains all scenarios, so you can compare them. The width of each flow shows its size. Use the year slider at the bottom to move through the years.
Tip: right-click a process or a flow in the graph to open its detailed data (inflows, outflows, stock, and all indicators).
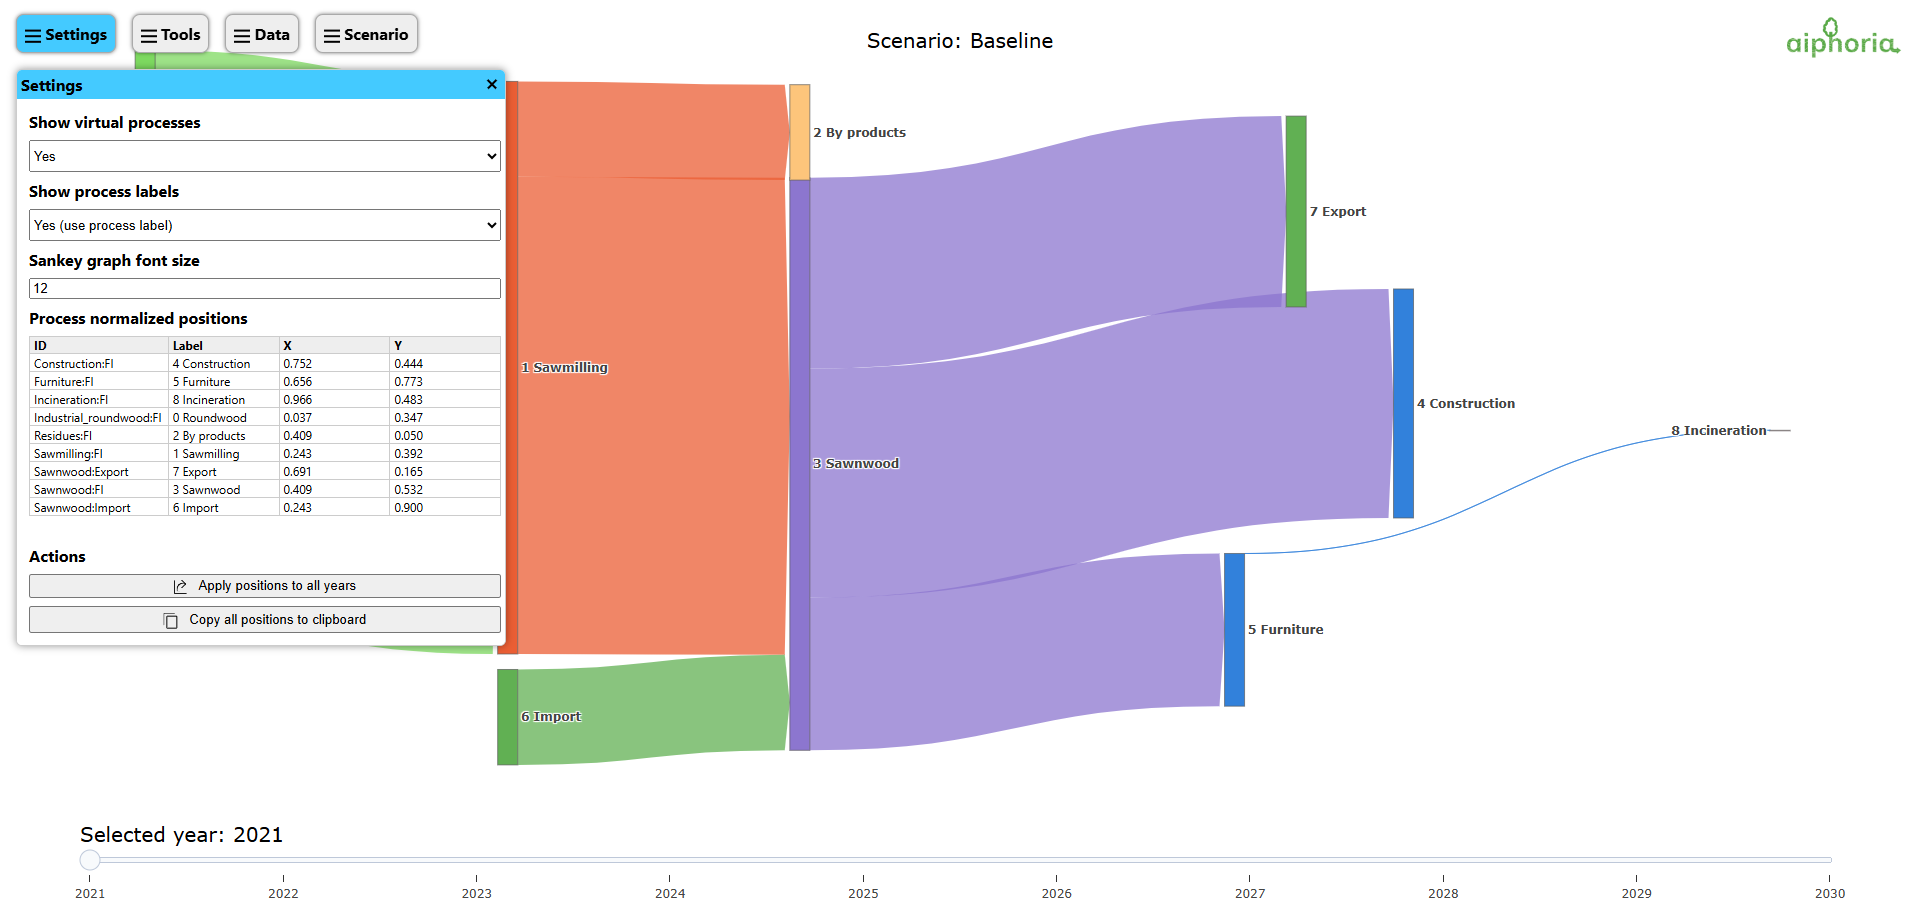
- Show or hide virtual processes
- Show process IDs or process labels
- Change the font size
- Move processes by hand, and apply the new positions to all years
- Copy all process positions to the clipboard
NOTE: To keep your process positions, click Copy all positions to clipboard and paste into the Process positions sheet (see Other sheets).
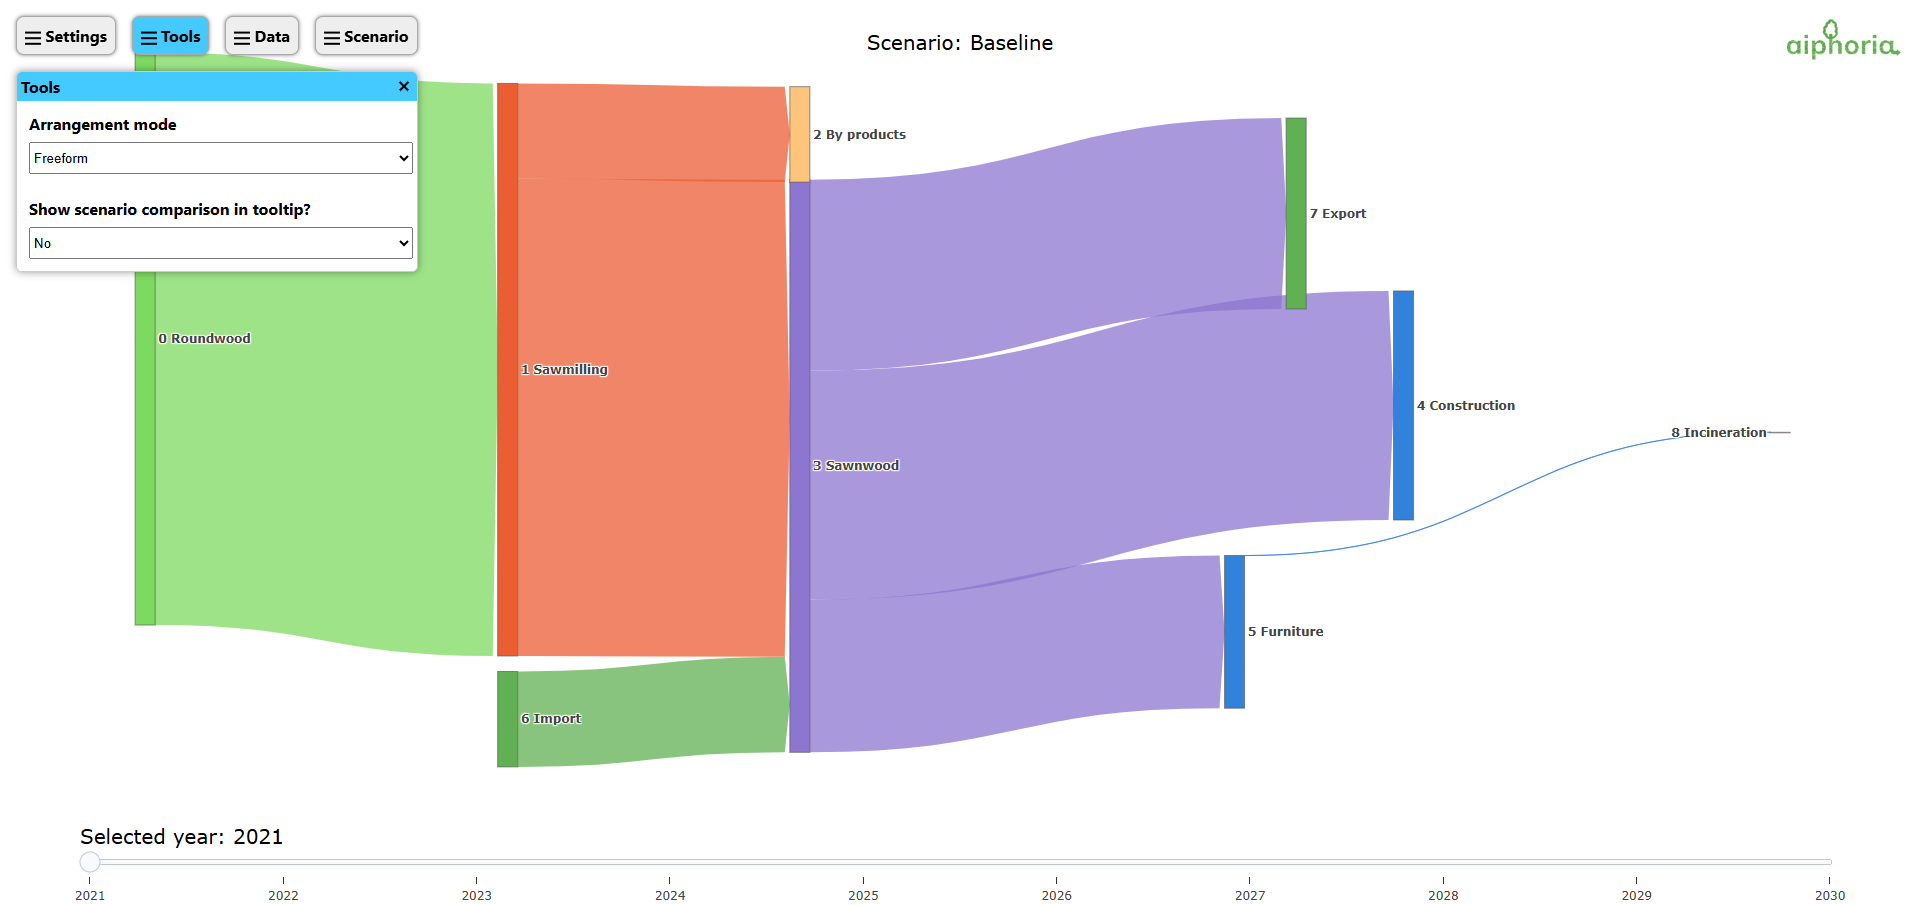
- Switch between free and perpendicular movement of processes
- Show a scenario comparison in the tooltip
With Show scenario comparison in tooltip? set to Yes, hovering over a process or flow shows how it differs between scenarios:
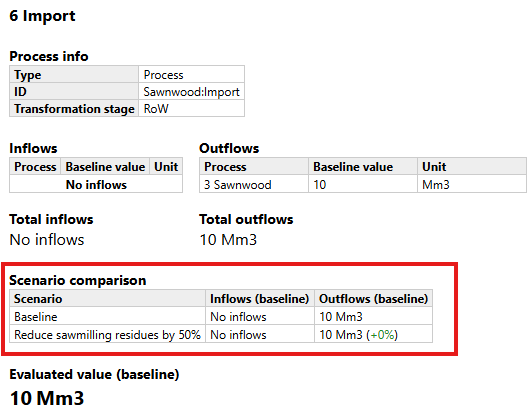
NOTE: Currently only the difference in the baseline value is shown.
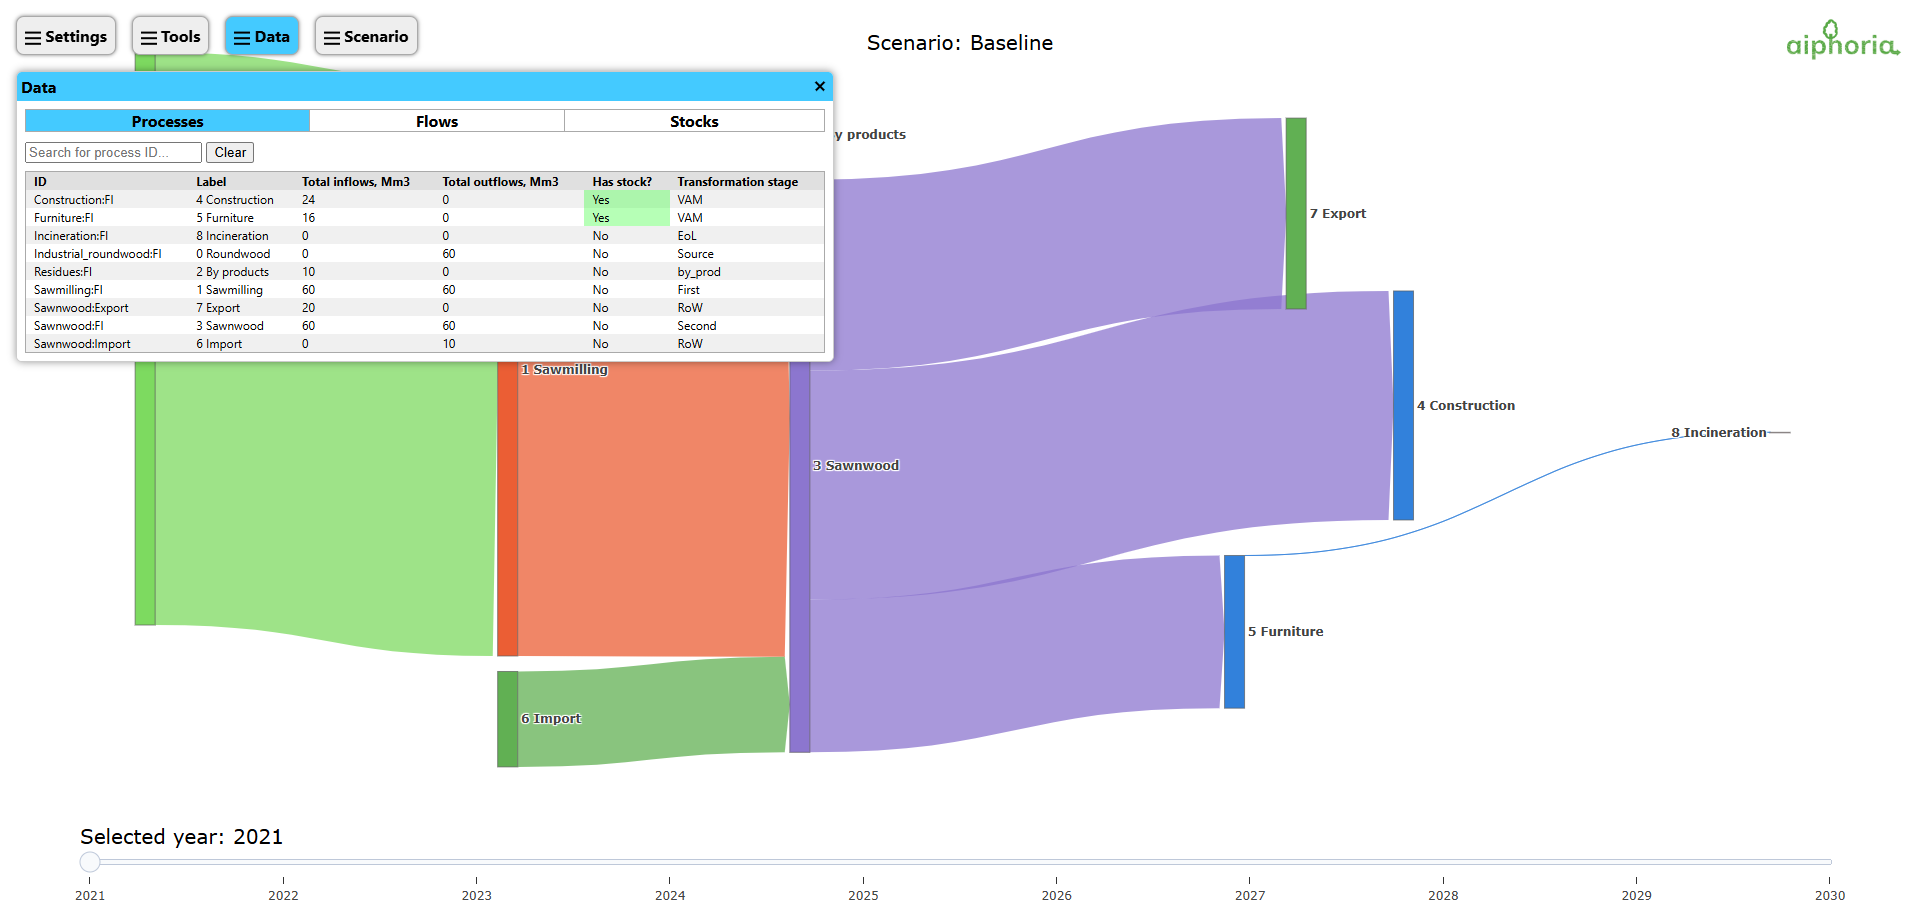
Browse detailed data for Processes, Flows, and Stocks. Switch between them with the tabs inside the Data window.
-
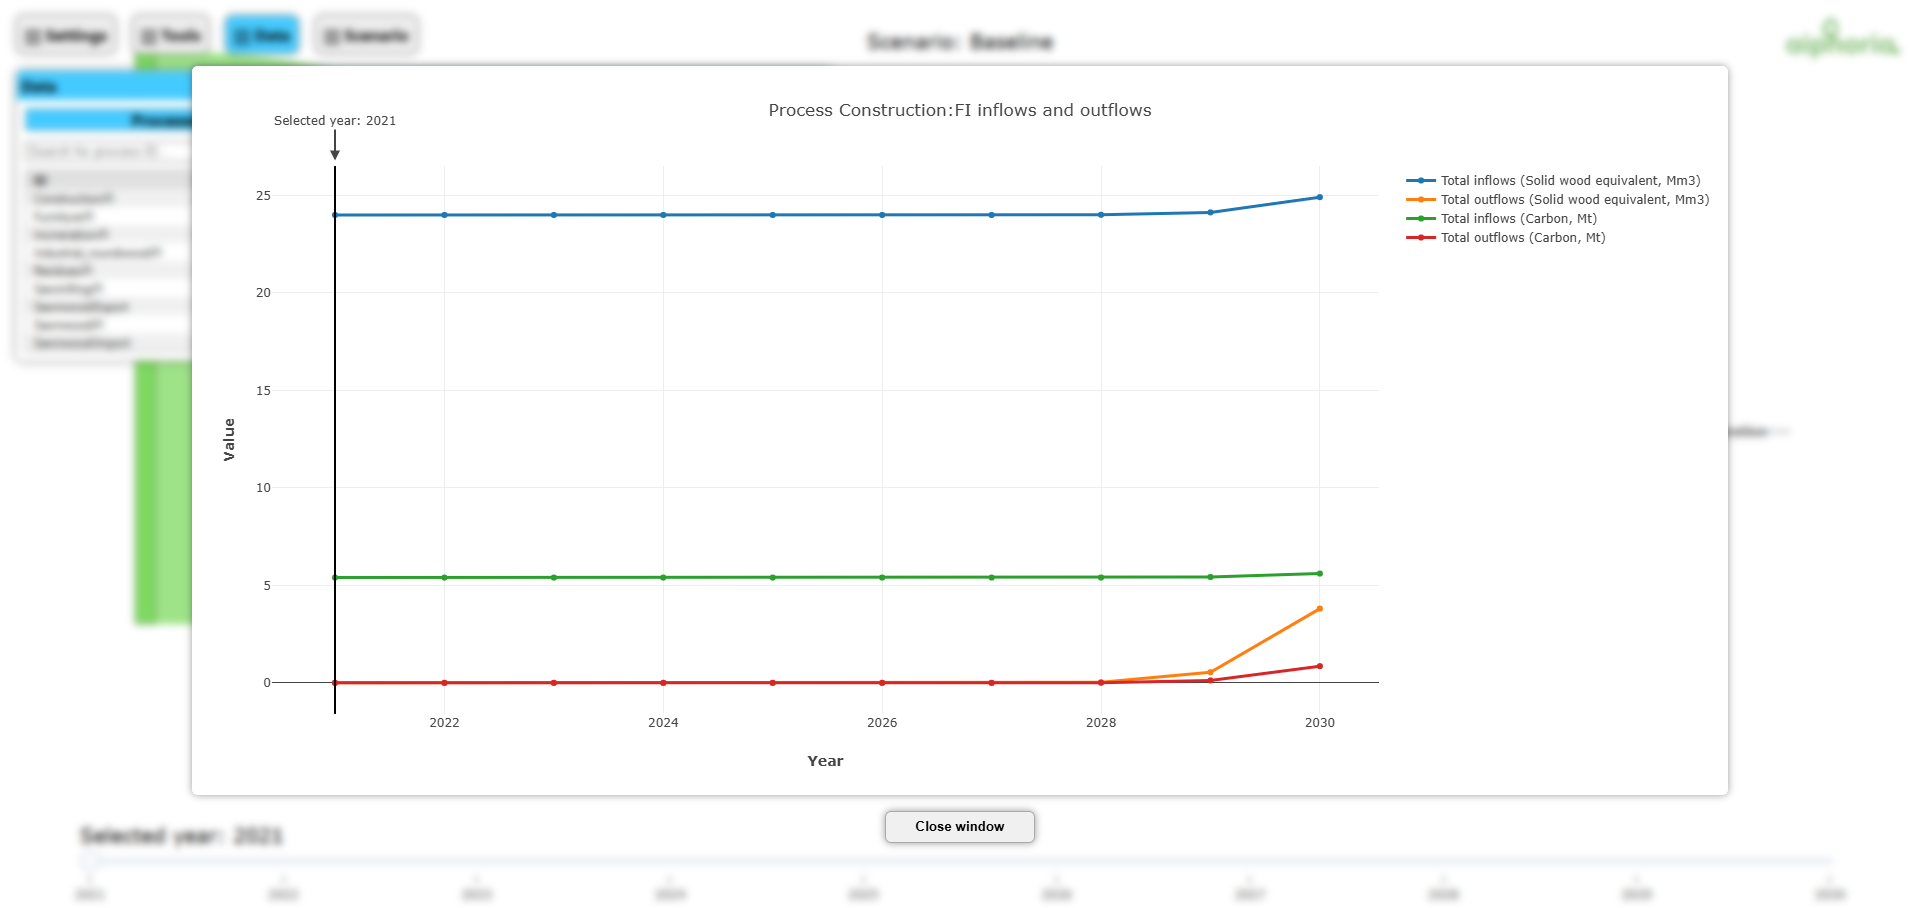
Processes: right-click an item and choose Show detailed process data. For stocks you can also choose Show detailed stock data. The window shows inflows and outflows, including all indicators; you can switch the baseline value and each indicator on or off on the right side of the chart.
-
Flows: right-click an item and choose Show detailed flow data.

-
Stocks: right-click an item to see stock inflows, outflows, and totals over time.

You can open the same windows by right-clicking a process or flow directly in the graph.

- Switch between scenarios with the Selected scenario drop-down
- See the scenario metadata (file name and time stamp), if
include_metadataisTRUE
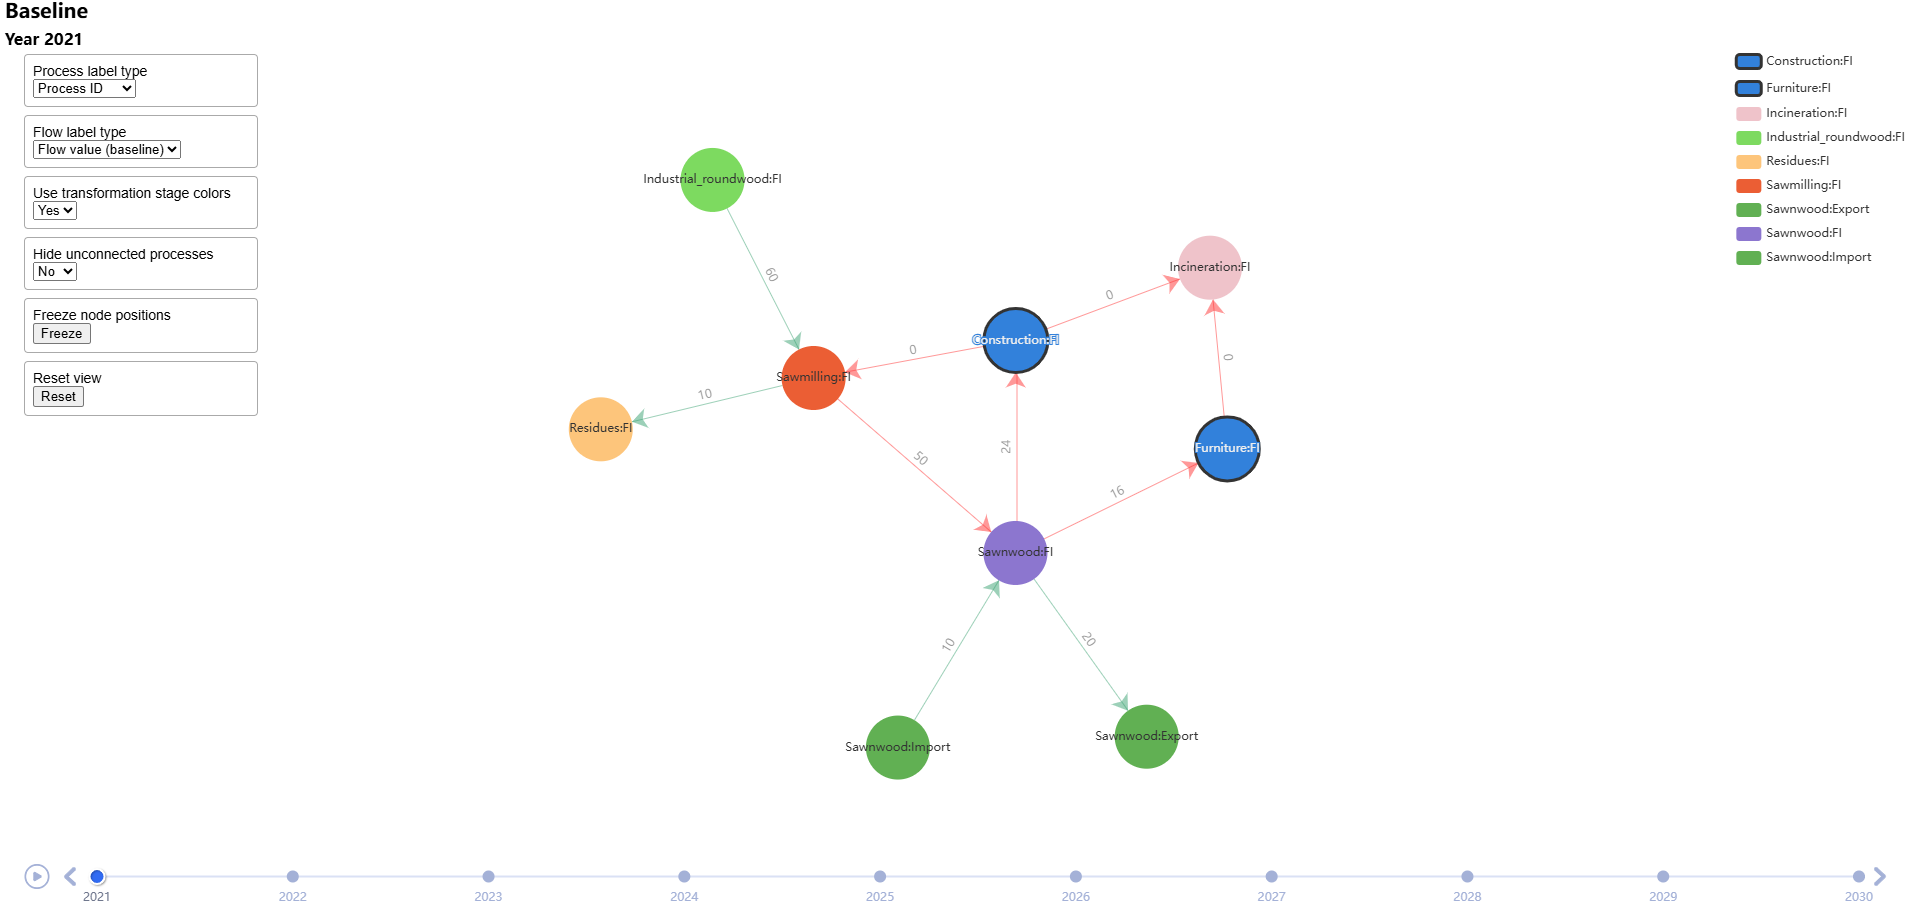
The network graph shows the whole system at a glance, for one scenario. Hover over a process or flow to see its details. Click process names in the legend (top-right) to hide or show them.
The panel at the top-left has these options:
| Option | What it does |
|---|---|
| Process label type | Show process IDs or your own labels |
| Flow label type | Show flow values, or the flow type (% or ABS) |
| Use transformation stage colors | Use your colours from the Colors sheet, or automatic colours |
| Hide unconnected processes | Hide processes without flows (useful for finding errors) |
| Freeze node positions | Keep processes in place. Changing the year hides them until you unfreeze. |
| Reset view | Return to the default view |
Next: Troubleshooting