Repository navigation
Part 3 Visualization
aiphoria can generate two types interactive visualizations:
- Network graph
- Sankey graph
Network graphs allows to see the system with it's connection in one glance.
Sankey graph allows to see the relative flow magnitude differences easily.
You can toggle generating these graphs with the following settings
- create_network_graphs
- create_sankey_charts
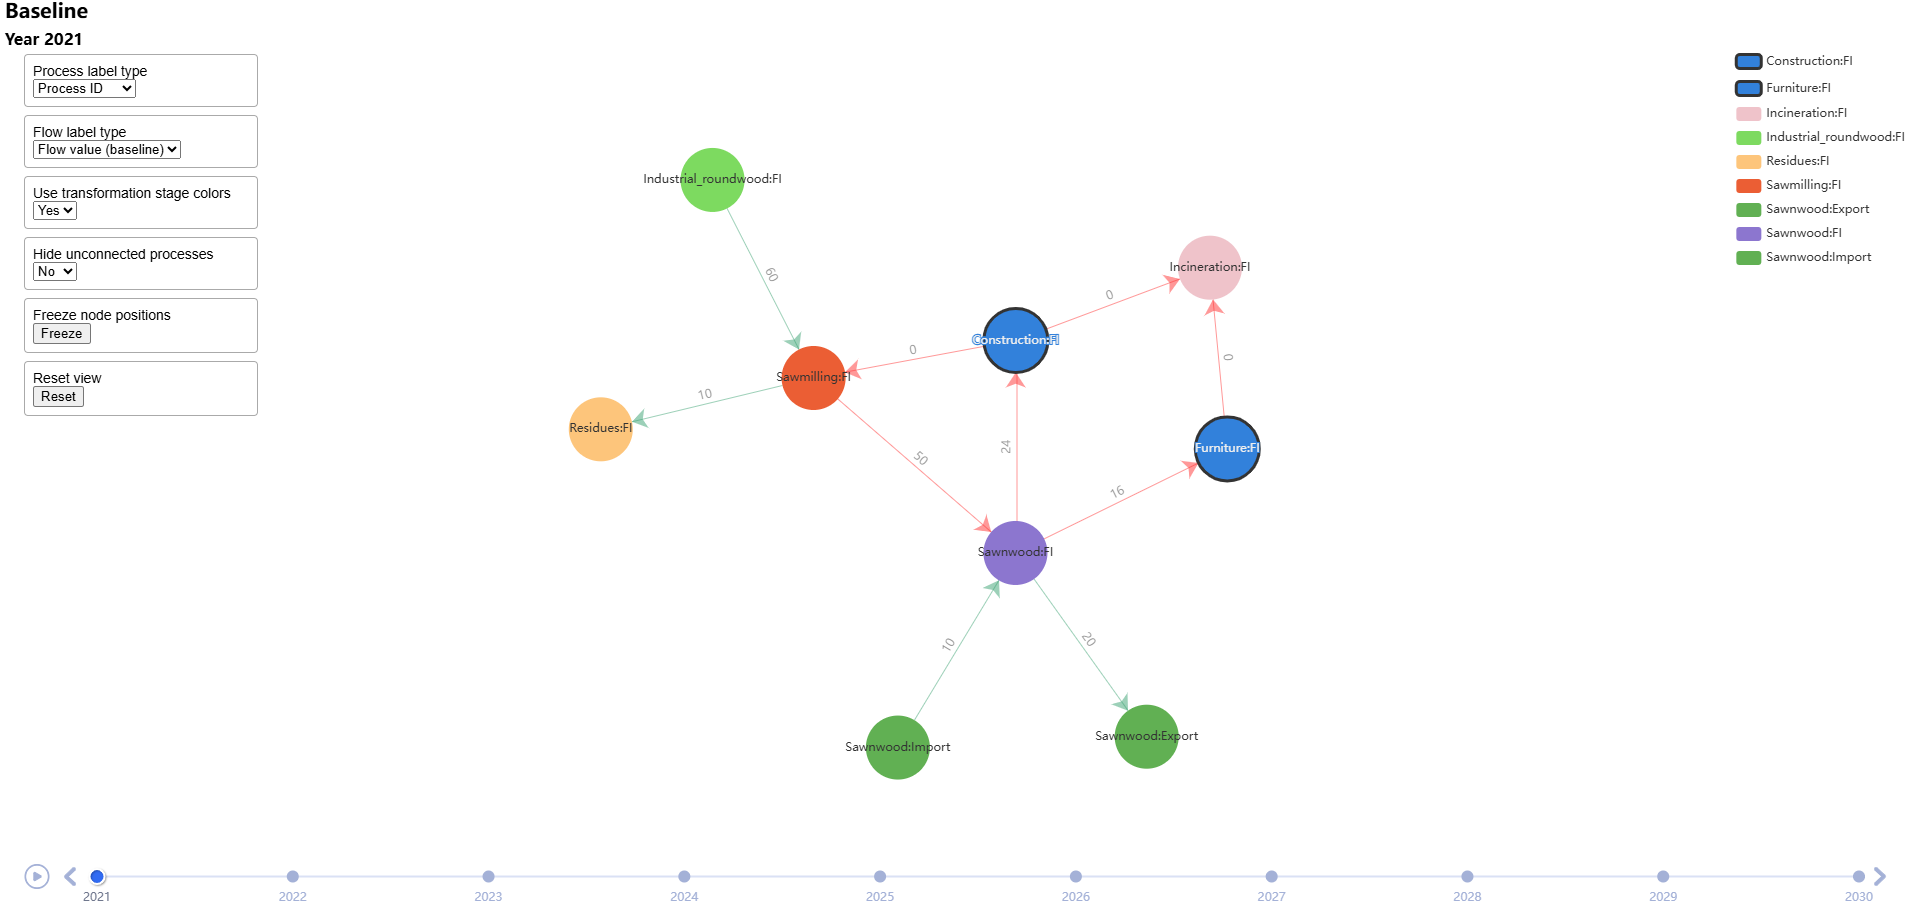
This graph is generated separately for each scenario and results are stored in the sub-directory inside
output directory.
You can see detailed information of the processes and flows by hovering over the elements in the graph.
Processes can be hidden or shown by clicking the process names in top-right corner controls.
You can change the your by clicking on the timeline on the bottom of the graph or by pressing left or right arrow keys.
| Action | Key or button |
|---|---|
| Go to next year | Right arrow key or clicking arrow on timeline right |
| Go to previous year | Left arrow key or clicking arrow on timeline |
| Go to first year | Home key |
| Go to last year | End key |
The top left view has controls for the options for the graph:
Here you toggle between showing process IDs or process labels (user-defined name)
Here you can toggle between evaluated flow value or flow type (% or ABS)
Here you can toggle between user-defined transformation stage colors or automatically generated colors
NOTE: Transformation stage colors can be defined in the sheet "Colors"
Here you can toggle between showing or hiding unconnected processes. This option is most useful for debugging purposes
Here you can freeze the node positions in-place.
NOTE: Changing the year causes the nodes to disappear and can be shown again by unfreezing the nodes.
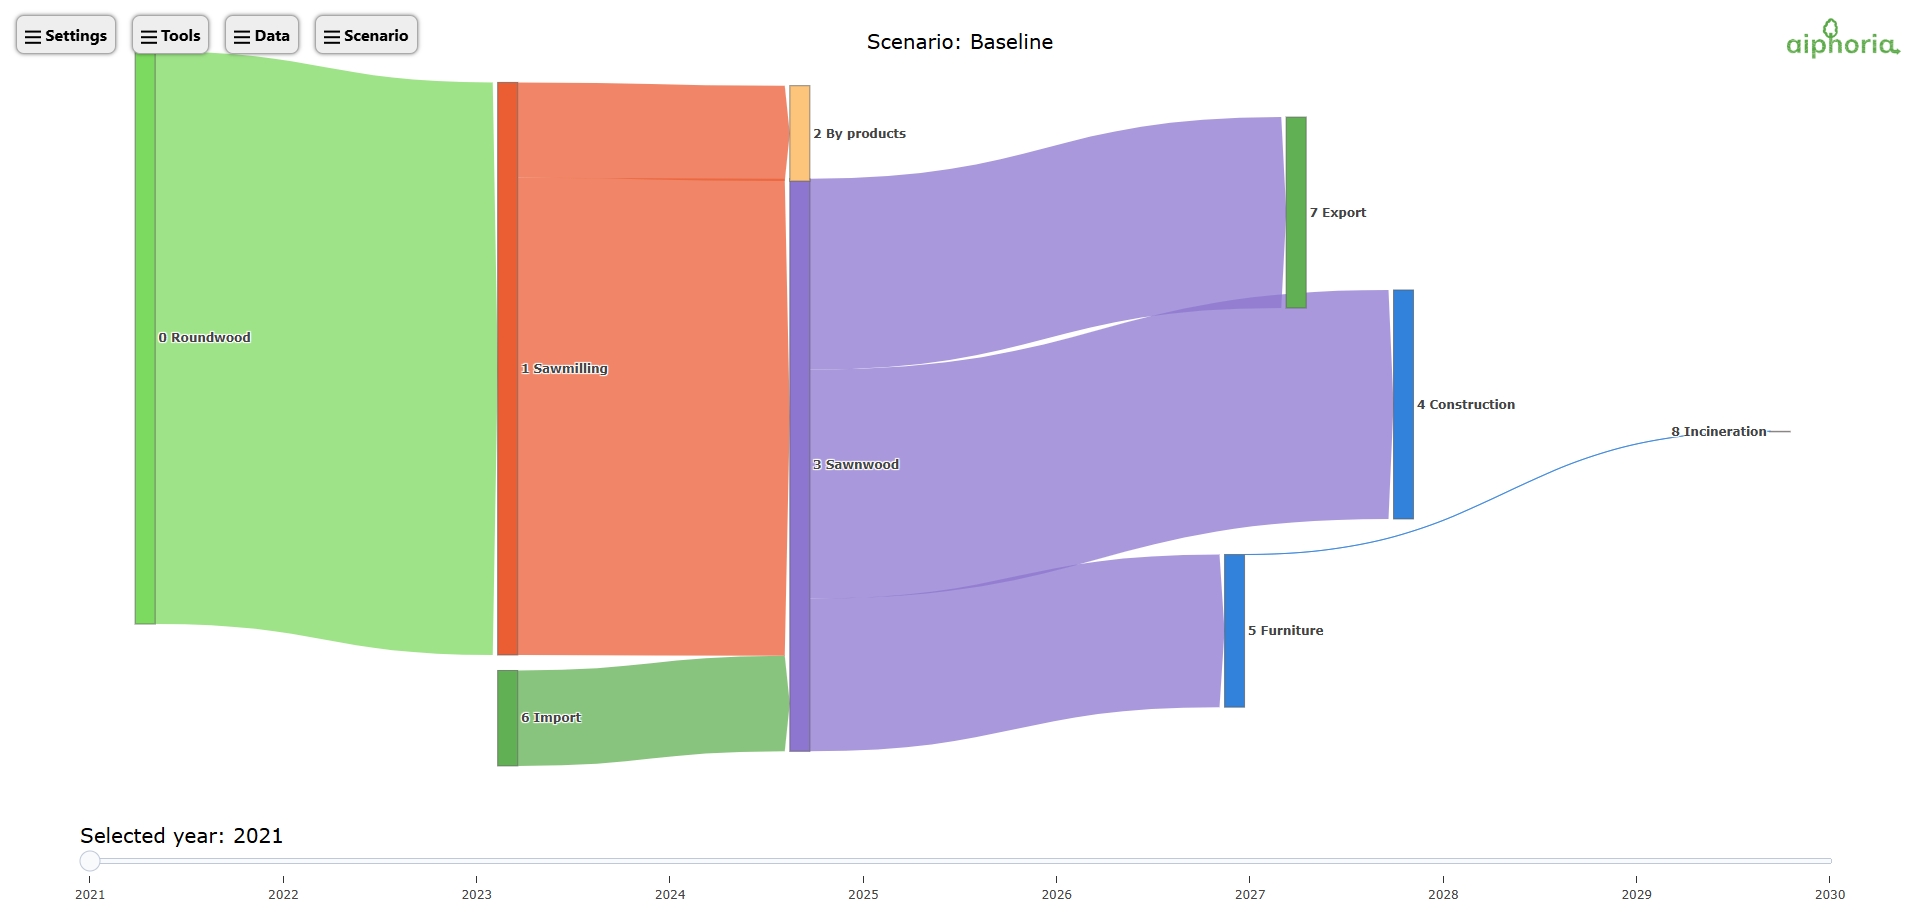
This graph includes data for all the scenarios and allows easy comparison of flow differences.
| Action | Key or button |
|---|---|
| Go to next year | Right arrow key or clicking arrow on timeline right |
| Go to previous year | Left arrow key or clicking arrow on timeline |
| Go to first year | Home key |
| Go to last year | End key |
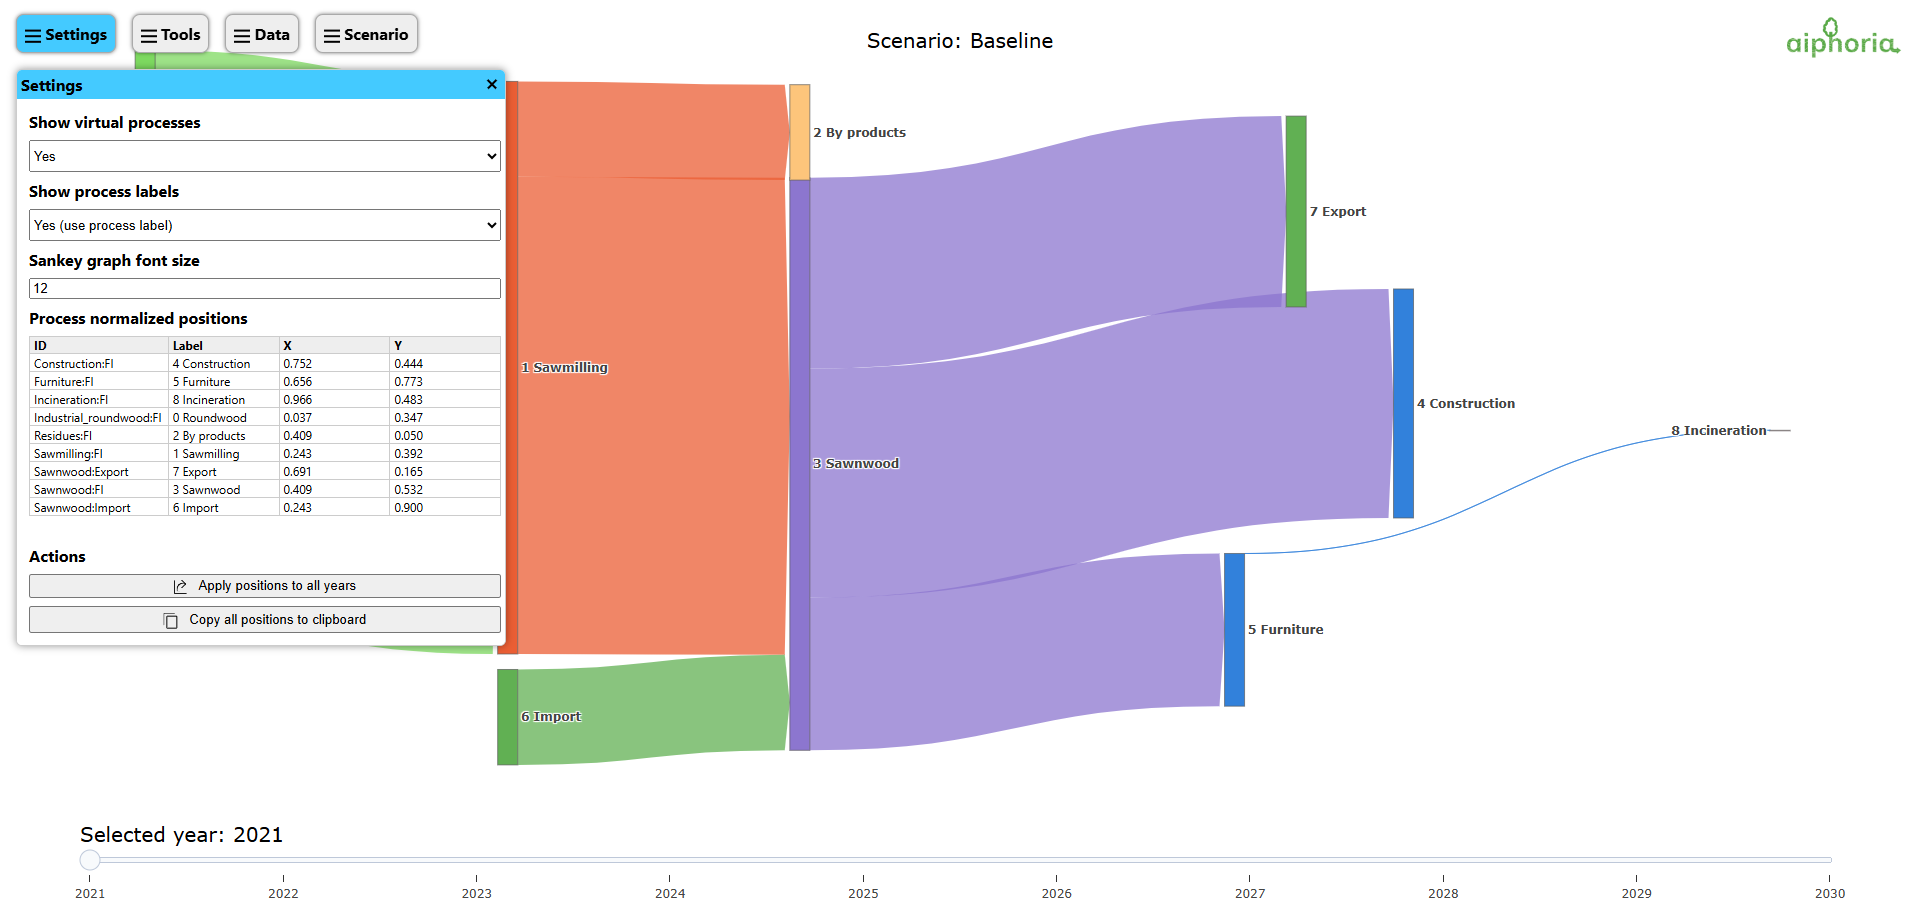
In this menu you can:
- Toggle virtual processes on/off
- Toggle showing process IDs / process labels
- Change the font size in the graph
- Edit manually process positions
- Apply new process positions to all years
- Copy all process positions to clipboard
NOTE: Click first the button "Copy all positions to clipboard" and then paste the contents to sheet "Process positions" if you want to preserve the process positions in settings file.
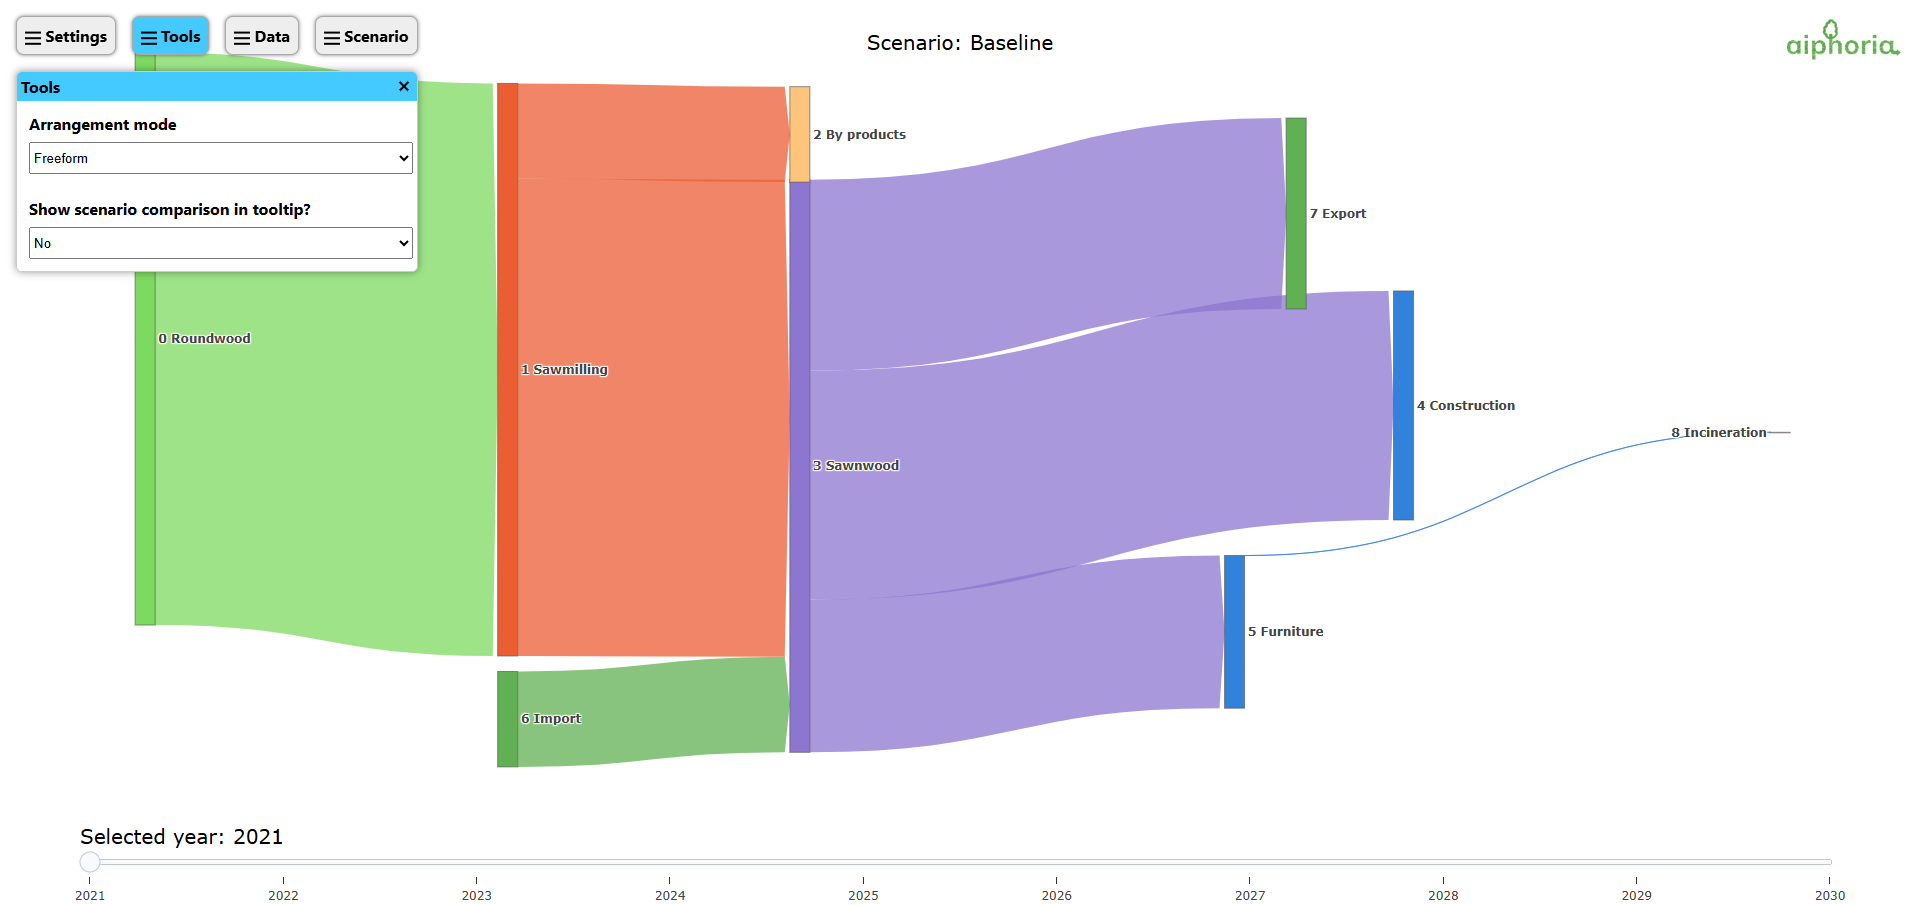
In this menu you can:
- Toggle between freeform and perpendicular process movement mode
- Toggle showing scenario comparison in tooltip
Setting "Show scenario comparison in tooltip?" to Yes you see detailed comparison of processes and flows when hovering
over the processes or flows in the graph like this:
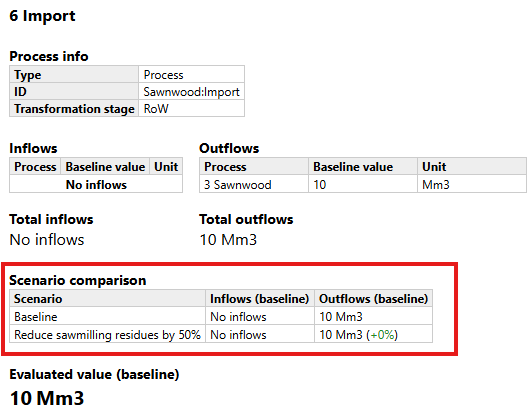
NOTE: Currently only the baseline value difference is shown
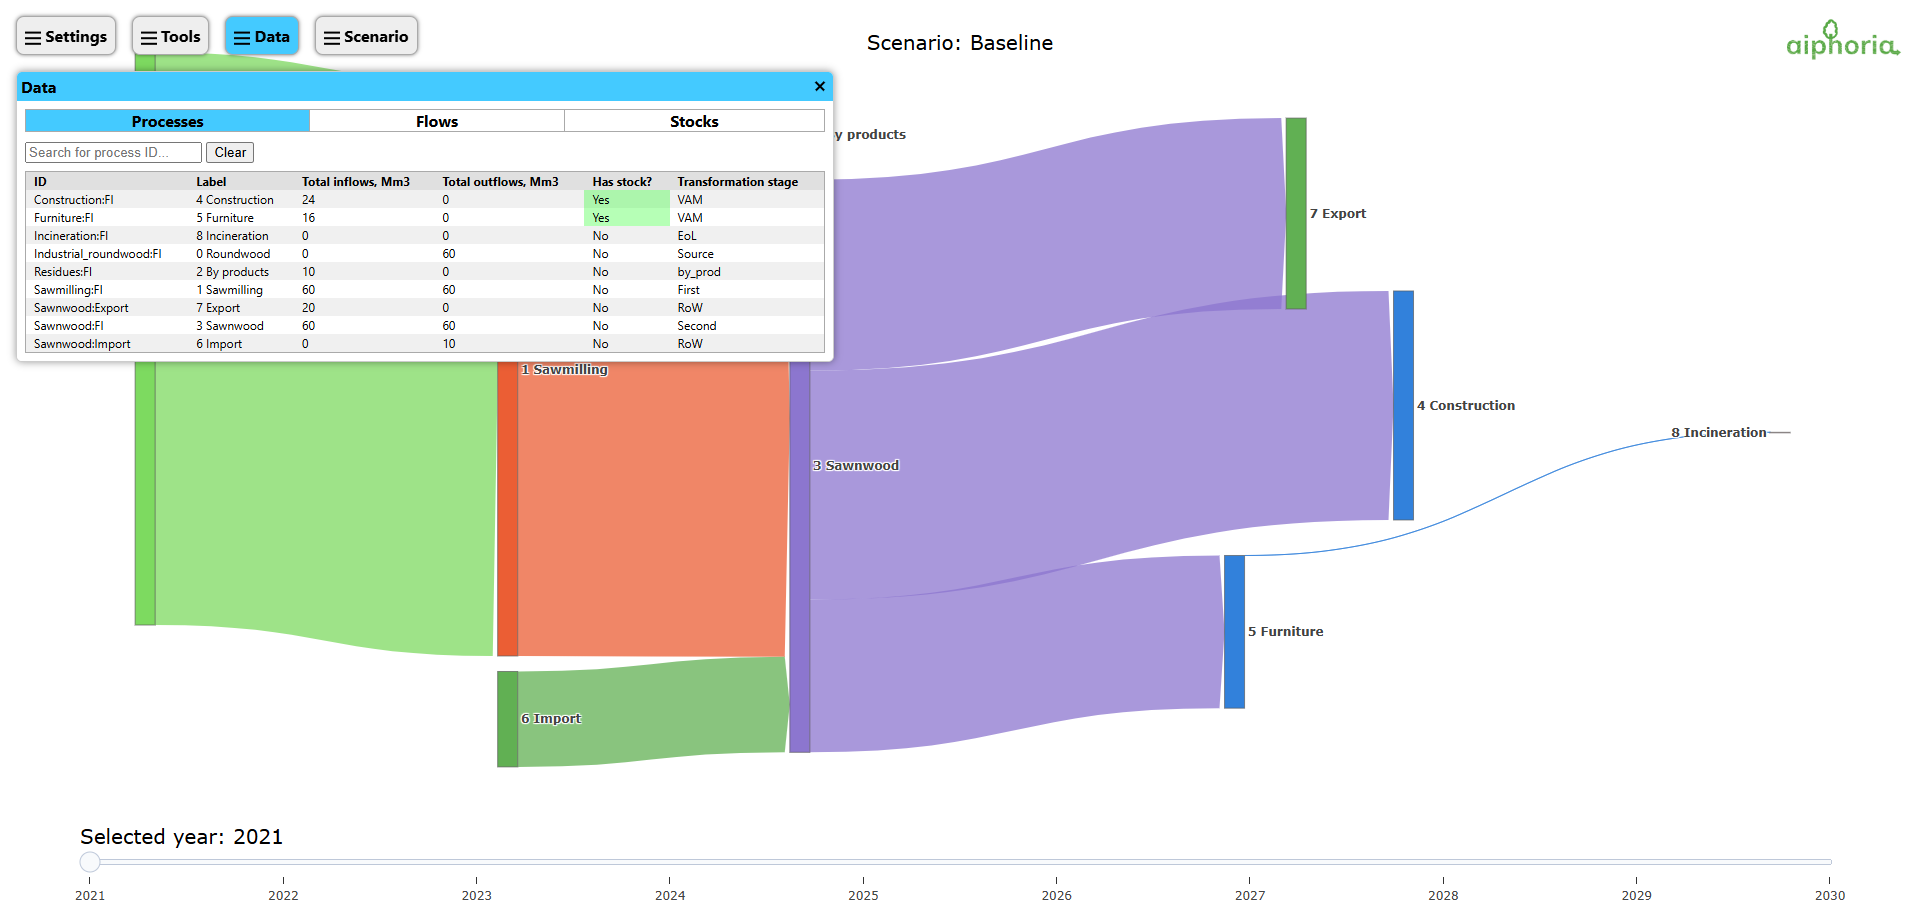 In this menu you can:
- Browse Processes with detailed info
- Browse Flows with detailed info
- Browse Stocks with detailed info
You can change the shown data by clicking the Processes, Flows, or Stocks -menu inside Data-window.
You can right-click in the items in the listing to open context menu:
- If process does not have stock, you'll see only "Show detailed process data" -option
- If process does have stock, you'll see both two options:
- Show detailed process data
- Show detailed stock data
By clicking option in context menu opens new window that contains more detailed process information:
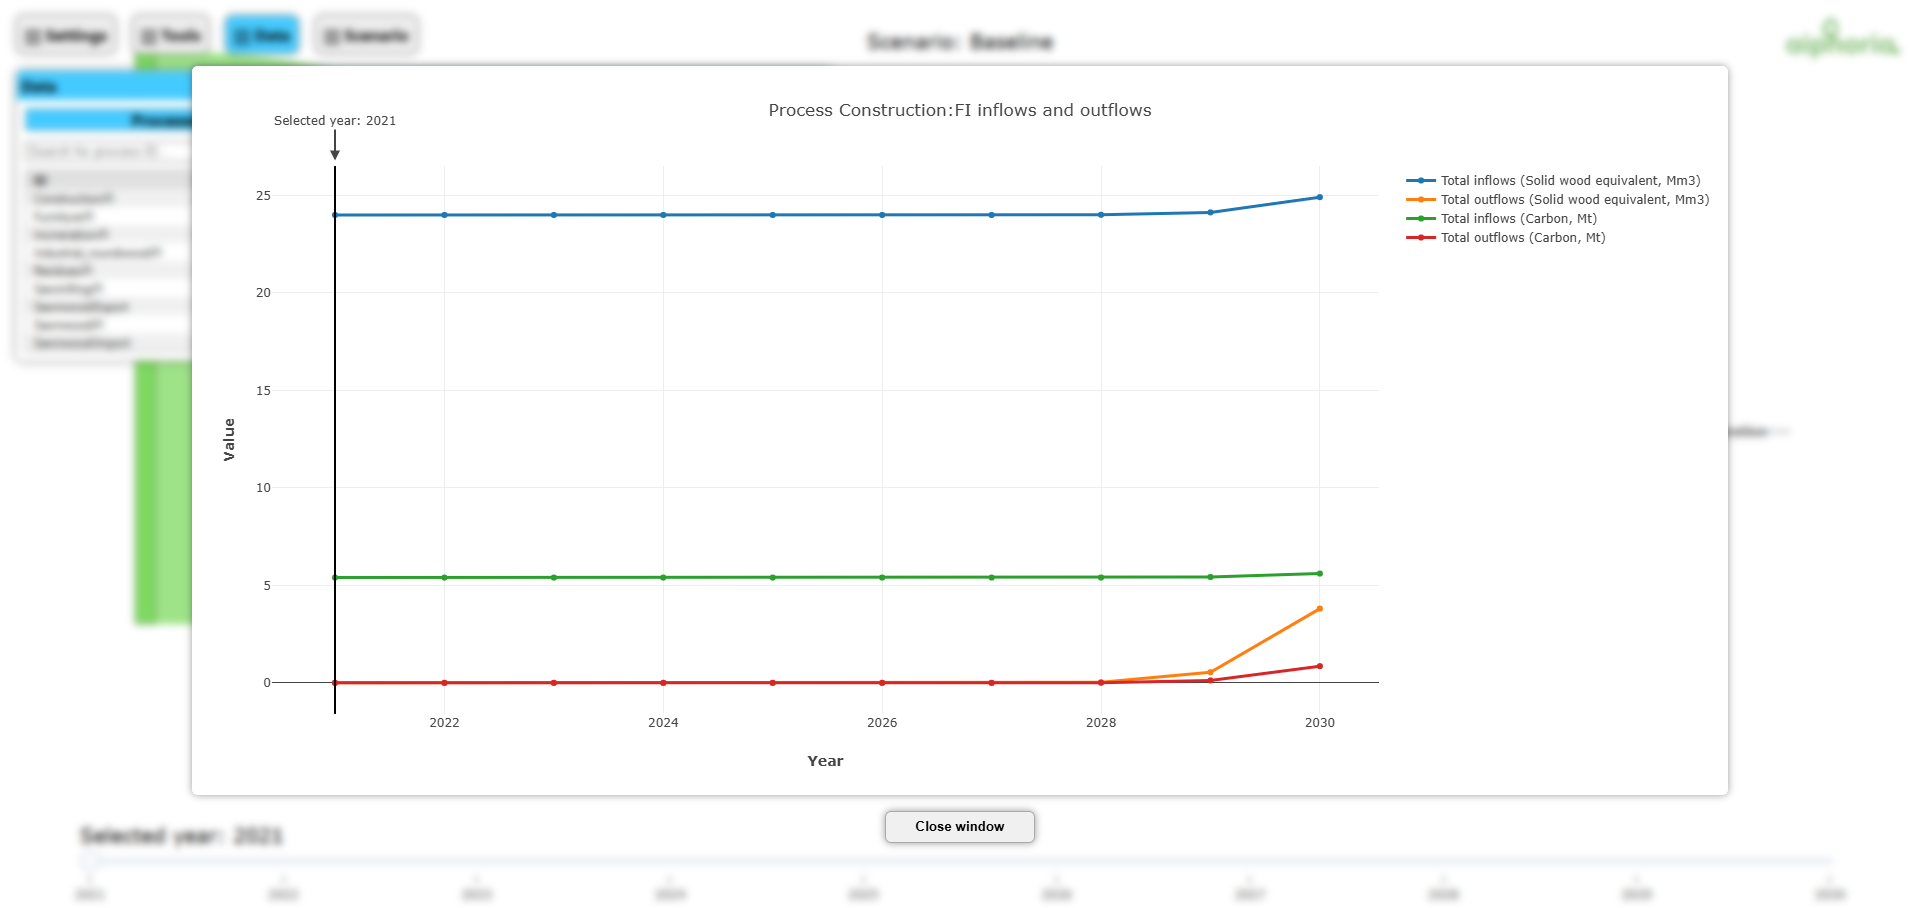
In this window you see the process inflows and outflows, including all the indicators.
You can also toggle on/off baseline or indicators on the right side of the graph to make graph cleaner.
If the process has stock you'll see similar graph including stock inflows, stock outflow, and stock totals.
NOTE: You can also right-click the process in Sankey graph to open up the context menu
You can right-click in the items in the listing to open context menu and select "Show detailed flow data" to open window
that shows more detailed information about the flow.

NOTE: You can also right-click the flow in Sankey graph to open up the context menu
You can right-click in the items in the listing to open context menu and select "Show detailed flow data" to open window
that shows more detailed information about the stock.

NOTE: You can also right-click the process in Sankey graph to open up the context menu

In this menu you can:
- Switch between different scenarios
- See scenario metadata (original filename and timestamp)
You can change the current scenario from the dropdown under Selected scenario.
NOTE: Generating this metadata can be turned on or off by using the setting include_metadata to TRUE
Previous part: Part 2 Settings