Repository navigation
Settings sheet
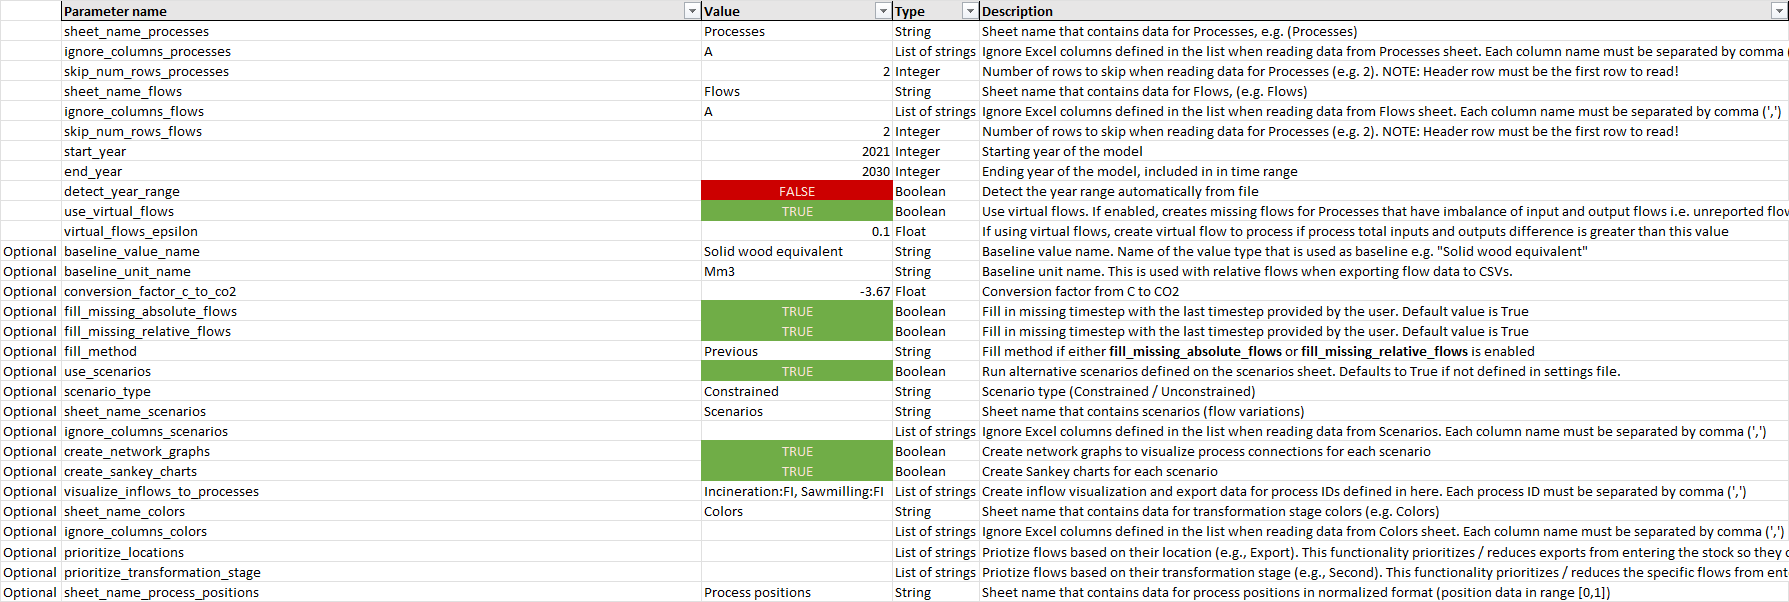
The Settings sheet holds the options for the whole model. aiphoria reads parameters from columns B and C (parameter name and value), from row 7 downward. The example file contains the same descriptions as this page, so you can use it as a template.
NOTE: Optional parameters can be left out. In that case aiphoria uses the default value shown below.
| Parameter | Description |
|---|---|
version |
Scenario file format number. Use 2 for aiphoria ≥ 1.1.0 (see Upgrading from older versions). |
sheet_name_processes |
Name of the sheet with processes, e.g. Processes
|
ignore_columns_processes |
Columns to skip in the Processes sheet, separated by commas, e.g. A,G
|
skip_num_rows_processes |
Rows to skip at the top of the Processes sheet (e.g. 2). The header row must be the first row read. |
sheet_name_flows |
Name of the sheet with flows, e.g. Flows
|
ignore_columns_flows |
Columns to skip in the Flows sheet, separated by commas |
skip_num_rows_flows |
Rows to skip at the top of the Flows sheet (e.g. 2). The header row must be the first row read. |
start_year |
First year of the model |
end_year |
Last year of the model (included) |
detect_year_range |
TRUE: take the year range from the data instead of start_year / end_year
|
use_virtual_flows |
TRUE: add virtual flows where a process does not balance (unreported flows). See Processes flows and stocks. |
virtual_flows_epsilon |
Smallest imbalance (absolute difference between inflows and outflows) that creates a virtual flow, e.g. 0.1
|
baseline_value_name |
Name of the baseline value, e.g. Solid wood equivalent. See Indicators. |
baseline_unit_name |
Unit of the baseline value, e.g. Mm3. Used for relative flows in the exported results. |
| Parameter | Default | Description |
|---|---|---|
fill_missing_absolute_flows |
TRUE |
Fill in years without data for absolute flows |
fill_missing_relative_flows |
TRUE |
Fill in years without data for relative flows |
fill_method |
Zeros |
How to fill: Zeros, Previous (repeat the last year with data), Next (use the next year with data), or Interpolate
|
NOTE: The default
fill_methodisZeros. If you give data only for some years and want them repeated, set it toPrevious(as in the example file).
| Parameter | Default | Description |
|---|---|---|
use_scenarios |
TRUE |
Run the alternative scenarios defined in the Scenarios sheet |
scenario_type |
Constrained |
Constrained or Unconstrained. See Scenarios and scenario modes. |
sheet_name_scenarios |
– | Name of the sheet with scenarios, e.g. Scenarios
|
ignore_columns_scenarios |
none | Columns to skip in the Scenarios sheet |
skip_num_rows_scenarios |
– | Rows to skip at the top of the Scenarios sheet |
| Parameter | Default | Description |
|---|---|---|
conversion_factor_c_to_co2 |
– | Factor from carbon (C) to CO2, used for CO2 removals from the Carbon indicator. The example uses −3.667 (−44/12); the minus sign reports a growing stock as a removal. See Indicators. |
use_stock_lifetime_overrides |
– |
TRUE: apply the changes in the Stock lifetime overrides sheet |
sheet_name_stock_lifetime_overrides |
– | Name of that sheet |
ignore_columns_stock_lifetime_overrides |
none | Columns to skip in that sheet |
skip_num_rows_stock_lifetime_overrides |
– | Rows to skip at the top of that sheet |
prioritize_locations |
none | Locations whose flows leave a stock process in the same year instead of entering the stock, e.g. Export
|
prioritize_transformation_stages |
none | The same for transformation stages, e.g. Second
|
| Parameter | Default | Description |
|---|---|---|
output_path |
output |
Output folder, relative to where you run the script |
create_sankey_charts |
TRUE |
Create the interactive Sankey graph |
create_network_graphs |
FALSE |
Create a network graph for each scenario |
visualize_inflows_to_processes |
none | Process IDs, separated by commas, for which inflow plots and data are exported (e.g. Incineration:FI, Sawmilling:FI) |
sheet_name_process_positions |
– | Sheet with process positions for the Sankey graph |
sheet_name_colors |
– | Sheet with transformation stage colours |
ignore_columns_colors |
none | Columns to skip in the Colors sheet |
include_metadata |
FALSE |
Show the scenario file name and creation time in the Sankey graph |
Next: Processes sheet