Repository navigation
Part 2 Settings
NOTE: Scenario file format has changed slightly in aiphoria v1.1.0
If this is your first time running aiphoria then feel free to skip this note section. The example scenario provided by aiphoria in versions >= 1.1.0 is already updated.
Old scenarios now contain columns that should be skipped when aiphoria reads the scenario file. All other columns than those mentioned below must be marked as ignored. You can also check the updated scenario file here.
Fastest way to upgrade old scenario file is to follow these steps:
- Add parameter version to Settings-sheet with value 2
- Change values for parameter ignore_columns_processes to A,G,J,K,L,M,N in Settings-sheet
- Change values for parameter ignore_columns_flows to A,B,C,D,E,F,G,M,N in Settings-sheet
Here is a list of columns that are required for Processes-sheet (order of columns is important!):
- Process
- Process location
- Process ID
- Transformation stage
- Lifetime
- Distribution type
- Distribution parameters
- Comment
- Normalized X
- Normalized Y
- Label shown in graph
Here is a list of columns that are required for Flows-sheet (order of columns is important!):
- Source ID
- Target ID
- Value
- Unit
- Year
- (Optional, must came in pairs (part 1/2)) First Indicator conversion factor (column name is the Indicator name)
- (Optional, must came in pairs (part 2/2)) First Indicator comment
- (Optional, must came in pairs (part 1/2)) Second Indicator conversion factor (column name is the Indicator name)
- (Optional, must came in pairs (part 2/2)) Second Indicator comment
- (Optional, must came in pairs (part 1/2)) ...
- (Optional, must came in pairs (part 2/2)) ...
aiphoria uses Excel files for storing scenario data. Main benefits for using Excel workbook is
- Keeping file count at minimum = only one settings file
- Allows storing all required data within one file = one sheet for one type of data
- Allows to do data validation in settings file = makes scenario configuration for user easier
When getting to know how the data is defined it's easier to modify the existing scenario and then introduce changes.
The example scenario can be downloaded here.
NOTE: Clear benefit of using the example scenario as a base template is that the example scenario contains the Excel data validation already included so rudimentary error-checking is already done in Excel-side before trying to run the scenario
- It's advised to NOT use spaces in process names because that might cause issues when trying to run the scenario
- aiphoria internally generates Process ID from name and location
Refer to example scenario how the data is defined
- It's advised to NOT use spaces in flow names because that might cause issues when trying to run the scenario
- aiphoria internally generates Flow ID from source process ID and target process ID separated by space
Refer to example scenario how the data is defined
Refer to example scenario how the data is defined
Example scenario file contains multiple sheets:
| Sheet name | Description |
|---|---|
| Settings | Contains scenario settings |
| Processes | Contains data for processes |
| Flows | Contains data for flows |
| Stock lifetime overrides | Contains data for stock lifetime overrides |
| Process positions | Contains process positions for Sankey graph |
| Scenarios | Contains alternative scenario definitions |
| Colors | Contains color data for transformation stages |
| Data validation parameters | Contains data for checking values inside Excel file |
NOTE: Sheet named Data validation parameters is only used for value validation inside Excel
These sheet names can be changed using parameters:
| Sheet name | Parameter name |
|---|---|
| Processes | sheet_name_processes |
| Flows | sheet_name_flows |
| Process positions | sheet_name_process_positions |
| Stock lifetime overrides | sheet_name_stock_lifetime_overrides |
| Scenarios | sheet_name_scenarios |
| Colors | sheet_name_colors |
| Parameter name | Is required? | Description |
|---|---|---|
| version | Yes | Scenario file format number. Used to detect old scenario files. Defaults to 2 |
| sheet_name_processes | Yes | Sheet name that contains data for Processes, e.g. (Processes) |
| ignore_columns_processes | Yes | Ignore Excel columns defined in the list when reading data from Processes sheet. Each column name must be separated by comma (',') |
| skip_num_rows_processes | Yes | Number of rows to skip when reading data for Processes (e.g. 2). NOTE: Header row must be the first row to read! |
| sheet_name_flows | Yes | Sheet name that contains data for Flows, (e.g. Flows) |
| ignore_columns_flows | Yes | Ignore Excel columns defined in the list when reading data from Flows sheet. Each column name must be separated by comma (',') |
| skip_num_rows_flows | Yes | Number of rows to skip when reading data for Processes (e.g. 2). NOTE: Header row must be the first row to read! |
| start_year | Yes | Starting year of the model |
| end_year | Yes | Ending year of the model, included in in time range |
| detect_year_range | Yes | Detect the year range automatically from file |
| use_virtual_flows | Yes | Use virtual flows. If enabled, creates missing flows for Processes that have imbalance of input and output flows i.e. unreported flows |
| virtual_flows_epsilon | Yes | If using virtual flows, create virtual flow to process if process total inputs and outputs difference is greater than this value |
| baseline_value_name | Yes | Baseline value name. Name of the value type that is used as baseline e.g. "Solid wood equivalent" |
| baseline_unit_name | Yes | Baseline unit name. This is used with relative flows when exporting flow data to CSVs. |
| conversion_factor_c_to_co2 | No | Conversion factor from C to CO2 |
| fill_missing_absolute_flows | No | Fill in missing timestep with the last timestep provided by the user. Default value is True |
| fill_missing_relative_flows | No | Fill in missing timestep with the last timestep provided by the user. Default value is True |
| fill_method | No | Fill method if either fill_missing_absolute_flows or fill_missing_relative_flows is enabled |
| use_scenarios | No | Run alternative scenarios defined on the scenarios sheet. Defaults to True if not defined in settings file. |
| scenario_type | No | Scenario type (Constrained / Unconstrained) |
| sheet_name_scenarios | No | Sheet name that contains scenarios (flow variations) |
| ignore_columns_scenarios | No | Ignore Excel columns defined in the list when reading data from Scenarios. Each column name must be separated by comma (',') |
| create_network_graphs | No | Create network graphs to visualize process connections for each scenario |
| create_sankey_charts | No | Create Sankey charts for each scenario |
| visualize_inflows_to_processes | No | Create inflow visualization and export data for process IDs defined in here. Each process ID must be separated by comma (',') |
| sheet_name_colors | No | Sheet name that contains data for transformation stage colors (e.g. Colors) |
| ignore_columns_colors | No | Ignore Excel columns defined in the list when reading data from Colors sheet. Each column name must be separated by comma (',') |
| prioritize_locations | No | Priotize flows based on their location (e.g., Export). This functionality prioritizes / reduces exports from entering the stock so they occur on the same timestep. |
| prioritize_transformation_stage | No | Priotize flows based on their transformation stage (e.g., Second). This functionality prioritizes / reduces the specific flows from entering the stock so they occur on the same timestep. |
| sheet_name_process_positions | No | Sheet name that contains data for process positions in normalized format (position data in range [0,1]) |
| output_path | No | Output directory where results are stored. NOTE: This is relative to the directory the you are running the script. |
| include_metadata | No | Include scenario file metadata to Sankey visualization (e.g. filename and file creation timestamp). Defaults to False. |
| use_stock_lifetime_overrides | No | Use stock lifetime overrides (change stock lifetimes during evaluation) |
| sheet_name_stock_lifetime_overrides | No | Sheet name that contains stock lifetime overrides. |
| ignore_columns_stock_lifetime_overrides | No | Ignore Excel columns defined in the list when reading data from Stock lifetime overrides sheet. Each column name must be separated by comma (',') |
| skip_num_rows_stock_lifetime_overrides | No | Number of rows to skip when reading data for Stock lifetime overrides (e.g. 2). NOTE: Header row must be the first row to read! |
Example scenario file has the same descriptions as seen here: that file can be used as template when creating new scenarios.
NOTE: If parameter is not required then it can be left out: in that case internal default value is used.
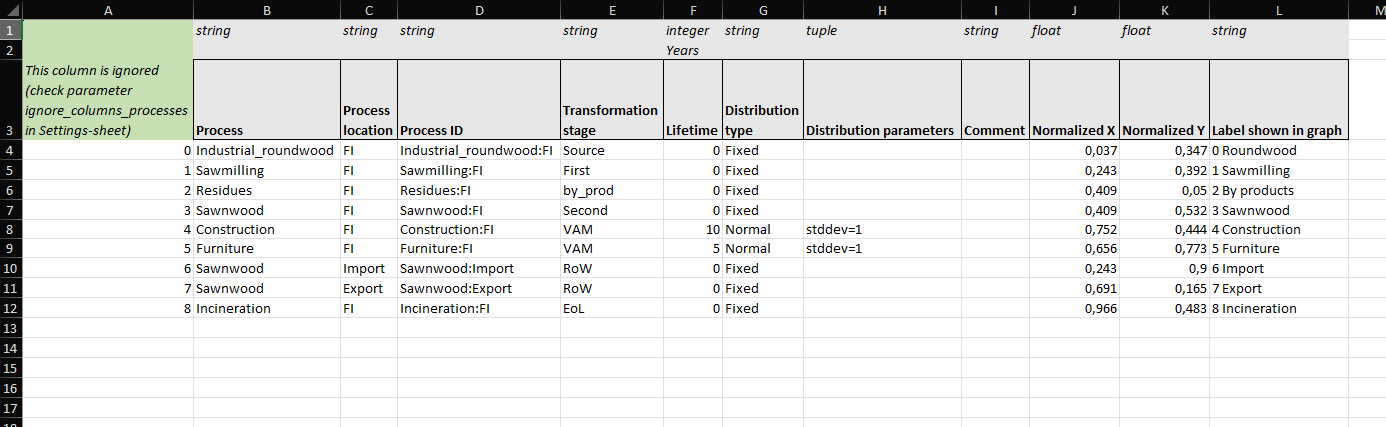
In this sheet you define process properties (e.g. name, transformation stage, stock type)
Here is breakdown of columns in Process-sheet:
The most important columns in the example scenario file are as follows:
- Column A:
- Ignored / not used
- Can be used as comment field
NOTE: List of columns to ignore while aiphora reads the settings file can be defined in the Settings-sheet
- Column B - Process
- Name of the process
- Name of the process
- Column C - Process location
- Location name where process is located, used as part of process ID
- Location name where process is located, used as part of process ID
- Column D - Process ID
- Process ID, process unique identifier and used internally when solving flows
- NOTE: Must be unique
- Column E - Transformation stage
- Transformation stage where process belongs
- Process and flow colors are based on the transformation stage in interactive visualizations
- Column F - Lifetime
- Process lifetime
- Process will become stock if lifetime > 0
- Column G - Distribution type
- Stock distribution parameter (defines how stock "behaves")
- Options:
- Fixed
- Normal
- LogNormal
- FoldedNormal
- Weibull
- Simple
- LandfillDecayWood
- LandfillDecayPaper
- Column H - Distribution parameters
- Parameters for stock distribution function
- Parameters for stock distribution function
- Column I - Comment
- Comment field, can contain arbitrary text
- Comment field, can contain arbitrary text
- Column J - Normalized X
- Process normalized X position, can be left empty
- NOTE: If "Process position"-sheet is defined then uses process position from that sheet
- Column K - Normalized Y
- Process normalized Y position, can be left empty
- This is overridden by position defined in Process position -sheet
- NOTE: If "Process position"-sheet is defined then uses process position from that sheet
- Column L - Label shown in graph
- Process label shown in network graph and in Sankey chart
- Process label shown in network graph and in Sankey chart
NOTE: Processes with lifetime = 0 are processes where inflow and outflow happens during the same timestep and therefore those are not stocks.
Stock is just a process with defined lifetime. Depending on the selected distribution type, stock can be thought as a process with delayed outflows. For example with "Fixed" distribution type this is easy to see because lifetime works as a delay so that the inflows and outflowing from the process after the lifetime amount of years.
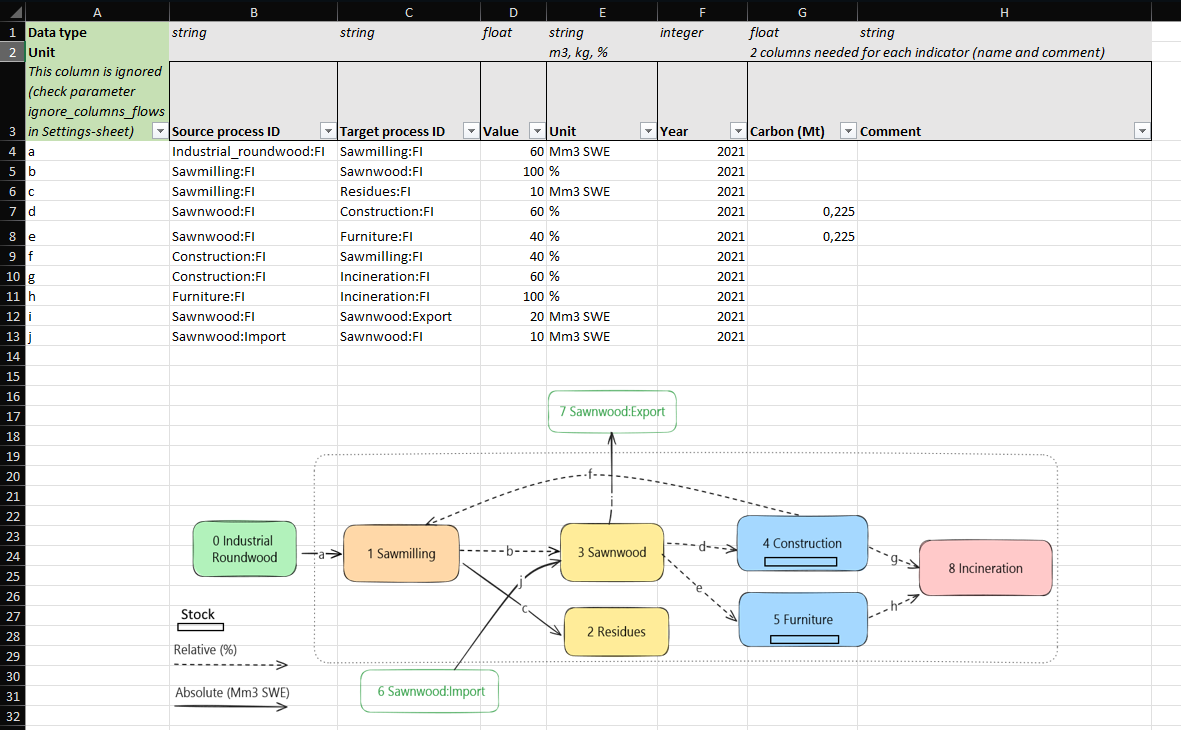
In this sheet you can define data for flows used in scenario.
Each year represents separate graphs and only flows that have the same year are part of that graph.
aiphoria can automatically fill flows for missing years if flow data exists only part of the selected simulation year range.
NOTE: To use automatic filling method following parameters in Settings-sheet:
- fill_method
- fill_missing_absolute_flows
- fill_missing_relative_flows
Here is breakdown of columns in Flows-sheet:
- Column A - Ignored (see Settings-sheet and parameter ignore_columns_flows)
- Comment field, can contain arbitrary text
- Comment field, can contain arbitrary text
- Column B - Source Process ID
- Flow source process ID - process ID where flow is coming from
- Process ID must match with the process ID defined in Processes-sheet
- NOTE: Example scenario uses cell formula for creating process ID
- Flow source process ID - process ID where flow is coming from
- Column C - Target Process ID
- Flow target process ID - process ID where flow is going to
- Process ID must match with the process ID defined in Processes-sheet
- NOTE: Example scenario uses cell formula for creating process ID
- Flow target process ID - process ID where flow is going to
- Column D - Value
- Flow value, represents baseline value (e.g. solid wood equivalent)
- Value must be always positive number
- Absolute values must be >= 0
- Relative values must be in range [0, 100]
- Column E - Unit
- Flow value unit name
- Relative flow is defined by using '%', otherwise flow is absolute
- NOTE: No automatic conversion between units are done, values in rows are used as text only
- Column F - Year
- Year when flow happens
- Year when flow happens
- Column G - Indicator name (here named as Carbon (Mt))
- Indicator name is defined by column title:
- Indicator name is the part before parenthesis e.g. Carbon
- Indicator unit is defined inside parenthesis e.g. Mt
- Indicator conversion factor is defined for rows after the indicator name
- Indicator conversion factor is multiplier from baseline e.g. value of 0.2 is 20% of baseline value
- Default indicator conversion factor of 1.0 is used if row is left empty
- NOTE: Indicators columns must always come in pairs and in this order:
- Indicator name
- Indicator comment
- Indicator name is defined by column title:
- Column H - Indicator name (here names as "Comment")
- Defines indicator comment
- Comment field, can contain arbitrary text
NOTE: You can define multiple new indicators by adding two more columns for each new indicator needed:
- First column defines the indicator in header with unit in parenthesis (e.g. Carbon (Mt)) and rows in that columns are conversion factors
- Second column is comment field
Error message is raised if indicator does not have the two required columns
DO NOT add any extra metadata columns after indicator columns in Flows-sheet. Indicators should always be the last columns in that sheet!
Flows represent one-way connection between processes and each flow will have source process and target process. There are two types of flows:
- absolute flows
- relative flows
Absolute flows represent constant values: these values are known before solving the system.
Relative flows represent unknown values and shares (as fraction of available outflow) that depends on other parts of the system.
NOTE: Relative flow should have value between 0 and 100%. Total sum of all relative outflows for one process should be 100%. When relative flow has value 100% it means everything that is available after absolute outflows.
Example about relative flows
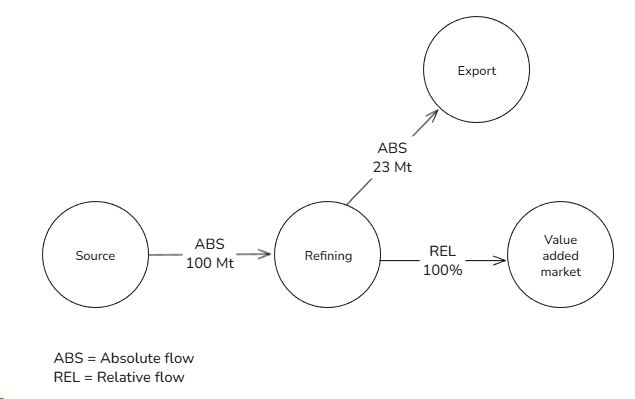
In this simplified scenario we know the absolute flows from "Refining" to "Export" but we don't know the value from "Refining" to "Value added market".
When solving the scenario relative flow from "Refining" to "Value added market" is going to betotal_in = Total inflows "Refining" = 100 Mt
total_out_abs = Total absolute outflows from "Refining" = 23 Mt
total_out_rel = total_in - total_out_abs = 100 Mt - 23 Mt = 77 MtAll total relative outflows from "Refining" is therefore 77 Mt.
The relative flow value is the share of that value = 77 Mt * 100% = 77 Mt

In this sheet you introduce change to stock lifetime during the evaluation. This is useful when stock lifetime changes during long simulation (e.g. when advancements in technology increases in-use products lifetime).
Here is breakdown of columns in Stock lifetime overrides -sheet:
- Column A - Ignored (see Settings-sheet and parameter ignore_columns_stock_lifetime_overrides)
- Comment field, can contain arbitrary text
- Comment field, can contain arbitrary text
- Column B - Process ID
- Name of the target process that contains stock
- NOTE: Must match with the name for process ID defined in Process-sheet
- Column C - Lifetime
- New stock lifetime (as whole number, number is rounded down and fractional part is ignored)
- NOTE: Expects integer
- Column D - Start year (included)
- Start year when new lifetime is introduced. This year is included in the time range.
- Start year when new lifetime is introduced. This year is included in the time range.
- Column E - End year (included)
- End year when new lifetime is introduced. This year is included in the time range.
- End year when new lifetime is introduced. This year is included in the time range.
- Column F - stddev
- Stock distribution parameter for stddev (standard deviation)
- NOTE: Used only in the following stock distribution types:
- Normal
- LogNormal
- FoldedNormal
- Column G - shape
- Stock distribution parameter for shape
- NOTE: Used only in the following stock distribution types:
- Weibull
- Weibull
- Column G - scale
- Stock distribution parameter for scale
- NOTE: Used only in the following stock distribution types:
- Weibull
- Weibull
- Column G - conditition
- Stock distribution parameter for condition
- NOTE: Used only in the following stock distribution types:
- LandfillDecayWood
- LandfillDecayPaper
- Column H - Comment
- Comment field, can contain arbitrary text
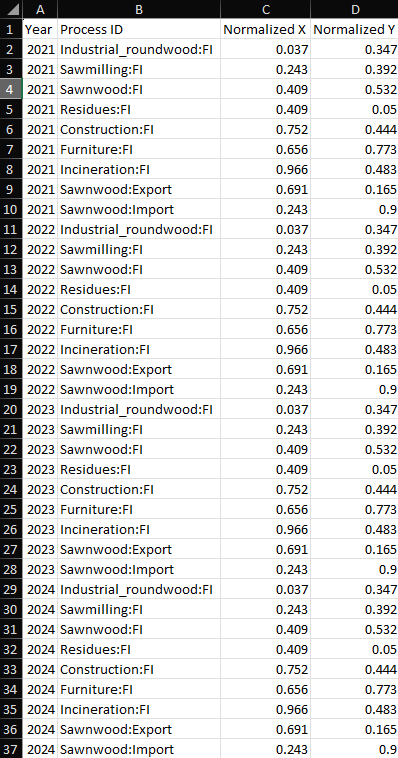
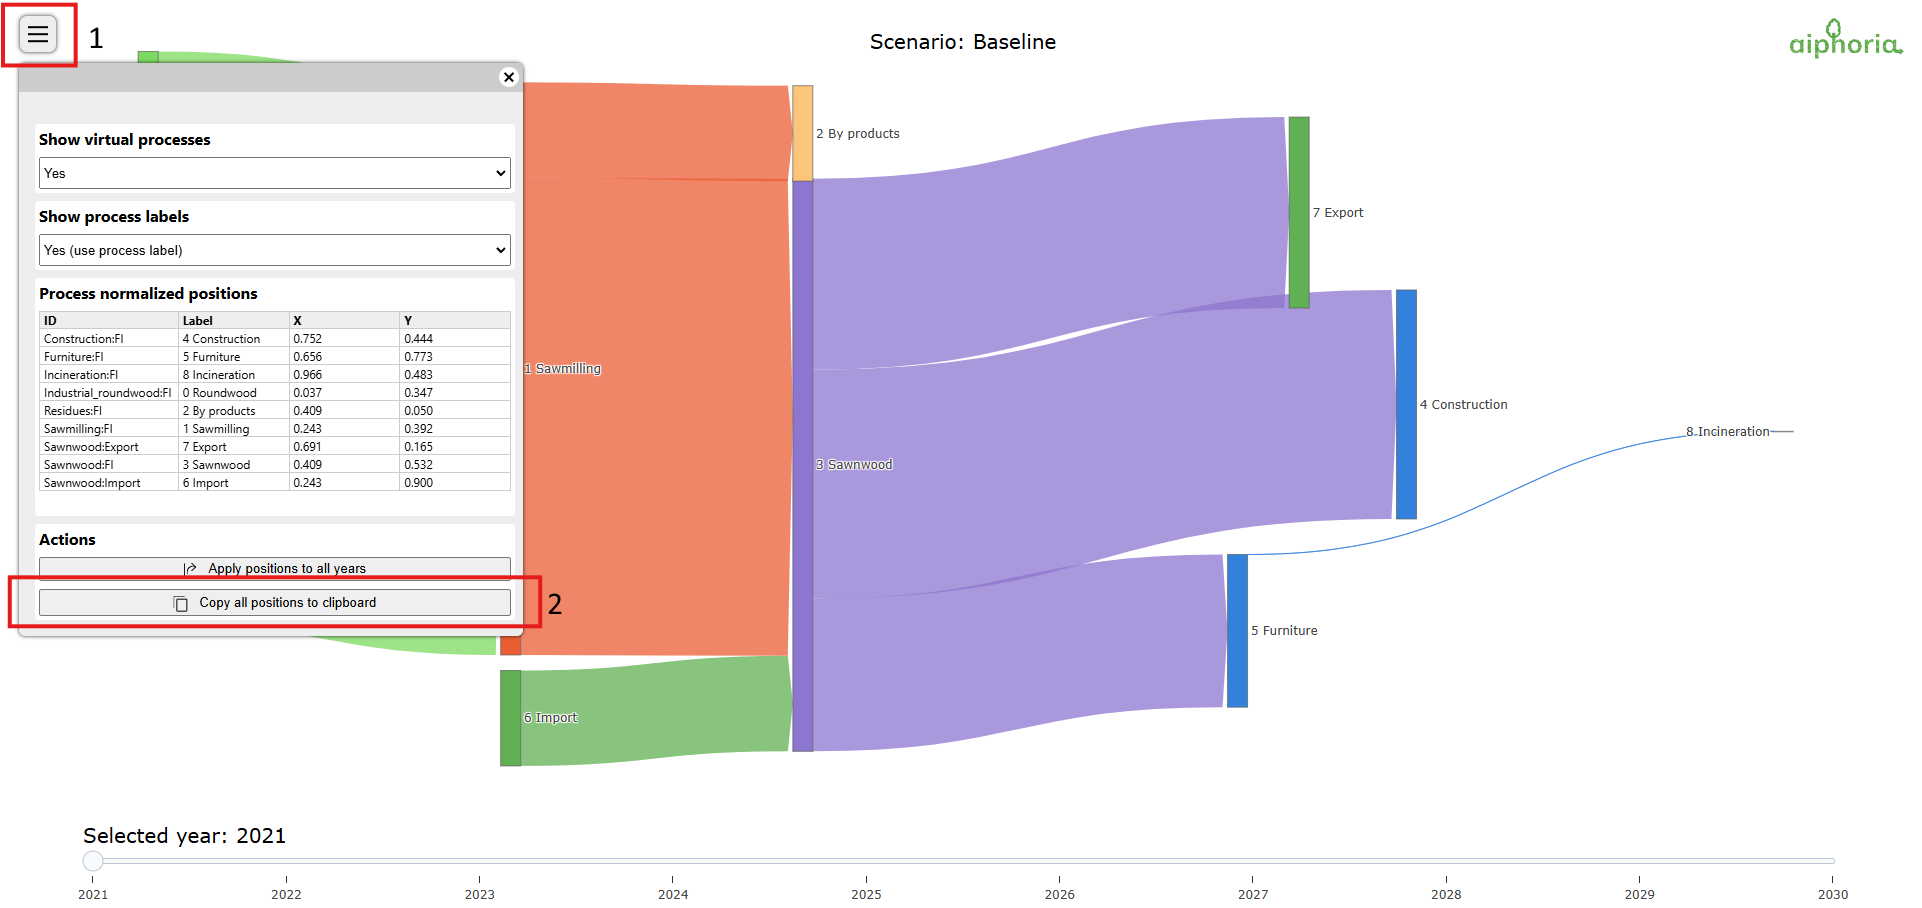
In this sheet you can define process positions for Sankey chart for every year.
Process X and Y position values must in normalized form (in range 0. ... 1.0).
Using normalized position values allows process positioning in Sankey graph to be resolution-independent.
NOTE: You can use copy positions for all years easily from Sankey chart visualization by:
- Open menu on top left corner (1)
- Clicking the button "Copy all position to clipboard"
- Select cell A1 in "Process positions" sheet and paste the results
In this sheet you can define alternative scenarios by introducing flow variations to the baseline scenario and that way create new scenarios during run-time.

NOTE: Alternative scenario means a baseline scenario that has been changed in some way, for example source flows are reduced by 50%. This feature is useful if want to analyse how system reacts when changes are introduced (e.g. how stock accumulation changes).
Flow modifications are localized to one process and has some requirements:
- Source process must be connected to target process by outflow
- The opposite target flow is sibling outflow of the targeted flow
- Sibling outflow is a flow that is also outflow from source process but can target other processes
Depending on the target flow type (absolute or relative), flow value can can be changed by either
- a) absolute value e.g. +10 units
- b) relative value e.g. +50% units
Flow value can be changed as follows:
- Absolute flows:
- Change in delta: absolute value change (e.g. -5 units) or relative change (e.g. 50% units)
- Target value: reach value during year range using function type for intermediate values
- Relative flows:
- Change in delta: change the flow share by delta value
- Target value: reach value during year range using function type for intermediate values
Here is breakdown of columns in Scenarios-sheet:
- Column A - Scenario name
- Every flow modification with the same name will be used in the same scenario
- Column B - Source process ID
- Source process ID
- Column C - Target process ID
- Target process ID
- Column D - Change in value (delta)
- Flow value change during year range
- NOTE: Depends on the change type and flow type
- Flow value change during year range
- Column E - Target value
- Target value at the end year
- Column F - Change type (Value or % = proportional)
- Value: absolute change in units or proportional change in values
- Column G - Start year (included)
- Start year for flow modification. Start year is include in the year range
- Column H - End year (included)
- End year for flow modification. End year is included in the range
- Column I - Function type
- Function type to modify flow value during year range
- Options:
- Constant
- Linear
- Exponential
- Sigmoid
- Options:
- Function type to modify flow value during year range
- Column J - Apply to targets
- Should apply flow modification also to target flows (either siblings or target flows defined)?
- Defaults to TRUE
- NOTE: This can be used to only modify source-to-target flow without applying changes to other flows
- Column K - Target process ID (where the opposite change is applied)
- Must be sibling outflows from the same source process where target value is applied
- There could be multiple of these columns defined: these columns contains process ID where the opposite effect is applied, otherwise introducing changes to system would cause mass imbalance to system and that would appear is missing or unreported flows.
- Target process ID must be connected to source process ID
- NOTE: If these columns are empty then opposite change is applied to all sibling outflows
Alternative scenarios are introduced by giving name for the flow modification in Scenarios-sheet: all rows using the same scenario name belong to the same scenario.
Flow data as it is in Excel file represents the baseline scenario and alternative scenarios are dynamically created in run-time by applying flow modifications on top of baseline scenario.
For example:
| Scenario | Source process ID | Target process ID | Change in value (delta) | Target value | Change type | ... |
|---|---|---|---|---|---|---|
| Scenario 1 | P1 | P2 | 50 | % | ... | |
| Scenario 1 | P1 | P2 | 50 | % | ... | |
| Scenario 2 | P0 | P1 | 25 | % | ... |
This configuration will create alternative scenarios so total of 3 scenarios are created during run-time:
- Baseline
- Scenario 1
- Scenario 2
NOTE: Baseline scenario is always created with the name "Baseline" to output directory
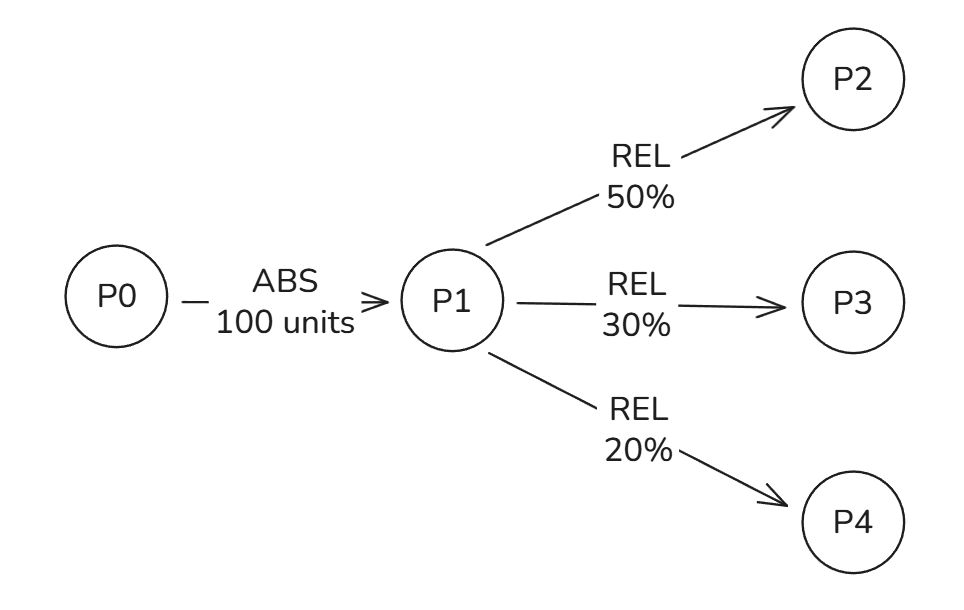
Processing order during run-time is as follows:
- Solve baseline scenario
- For every new scenario defined in Scenarios-sheet
- Copy baseline scenario data as base for new alternative scenario
- Apply all flow modifications for this new alternative scenario from Scenarios-sheet
- Solve new alternative scenario
In the example scenario there is one alternative scenario ("Reduce sawmilling residues by 50%") so let's break down how it works:
Value for flow between Sawmilling:FI and Residues:FI will be changed by -50% during the years 2025 - 2030 in linear fashion.
Function type Linear means that the flow value will be interpolated between the values in 2025 and 2030. Because
this rule is targeting absolute flow then that flow value will change from 10 Mm3 SWE to 5 Mm3 SWE in that time.
You can change how the alternative scenarios are processed by selecting between unconstrained or constrained mode using the parameter scenario_type in Settings-sheet.
The unconstrained mode:
- Suits to explorative cases
- If processes do not get enough inflows / outflows, virtual flows are introduced to the system to fill the gap
- Processing continues and visualizations are generate
In constrained mode:
- If the processes do not get enough inflows / outflows, aiphoria reports the largest possible deficit
- Processing stops and no visualizations are generated
Previous part: Part 1 Usage
Next part: Part 3 Visualization