Repository navigation
Processes flows and stocks
This page explains the building blocks of an aiphoria model. You need these ideas to fill in the Processes sheet and the Flows sheet.
A process is a step in the system where material goes in and comes out, for example Sawmilling, Construction, or Incineration.
- Every process has a name and a location. Together they form the process ID, written
Name:Location(for exampleSawmilling:FI). The location lets you have the same process in several places (for exampleSawnwood:FI,Sawnwood:Import,Sawnwood:Export). - Every process belongs to a transformation stage (for example First, Second, EoL). The stage decides the colour of the process in the graphs (see the Colors sheet in Other sheets).
- Avoid spaces in process names; they can cause errors when the file is read.
A flow is a one-way connection from a source process to a target process, for one year. Its value is the baseline value, for example solid wood equivalent in Mm³ (set in the Settings sheet). Extra quantities such as carbon are added with Indicators.
There are two types of flows:
| Type | You give | Unit column | Meaning |
|---|---|---|---|
| Absolute flow | an amount | any label, e.g. Mm3
|
a known value, fixed before the system is solved |
| Relative flow | a share, 0–100 | % |
a share of what is left to leave the source process |
For each process and year, aiphoria:
- adds up everything that flows into the process,
- subtracts all absolute outflows,
- divides what is left between the relative outflows according to their shares.
So a relative flow of 100% means everything that is left after the absolute outflows. The relative outflows of one process should add up to 100%.
Example
Refining receives 100 Mt in total. We know its absolute outflow to Export (23 Mt), but not its flow to Value added market, which is given as a relative flow of 100%.
- Total inflows to Refining = 100 Mt
- Absolute outflows from Refining = 23 Mt
- Left for relative outflows = 100 − 23 = 77 Mt
The flow to Value added market is therefore 77 Mt × 100% = 77 Mt.
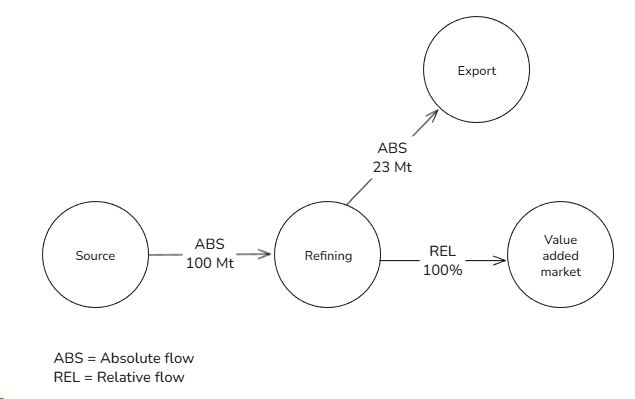
Mixing absolute and relative flows in this way lets you combine production and trade statistics (absolute amounts) with information on end uses (shares), without converting everything by hand first.
After solving, the inflows and outflows of every process should be equal. If your data do not close (for example an
unreported flow is missing), aiphoria can add virtual flows to balance the process. They come from, or go to,
virtual processes whose ID starts with VP_ (for example VP_Sawmilling:FI).
- Turn this on or off with
use_virtual_flowsin the Settings sheet. -
virtual_flows_epsilonsets how large the imbalance must be before a virtual flow is created. - Virtual flows are a useful check: they show where and by how much your data do not add up. You can show or hide them in the Sankey graph (see Interactive visualizations).
Virtual flows are also used by unconstrained scenarios (see Scenarios and scenario modes).
A stock is a process that keeps material for some time, for example wood in buildings or furniture in use.
- A process becomes a stock when its lifetime is greater than 0 in the Processes sheet.
- A process with lifetime 0 is not a stock: whatever goes in comes out in the same year.
- The lifetime can be longer than the simulation. Note that every stock starts empty in the first year, so for long-lived products start the simulation early enough (or include historical inflows) to avoid underestimating the stock in the first years.
For every stock, aiphoria uses ODYM's DynamicStockModel. Each year's inflow is a new cohort; the lifetime
distribution decides when each cohort leaves the stock. The outflow of a stock becomes a normal flow again in the
next year (for example to recycling or incineration).
| Distribution type | Parameters (column Distribution parameters) | Behaviour |
|---|---|---|
Fixed |
none | everything leaves exactly after the lifetime; the lifetime works as a delay |
Normal |
stddev |
outflows spread around the mean lifetime |
LogNormal |
stddev |
skewed spread, with a longer tail of long-lived products |
FoldedNormal |
stddev |
like Normal, without negative lifetimes |
Weibull |
shape, scale
|
flexible shape, often used for buildings |
Simple |
none | first-order (exponential) decay: the same share of the remaining stock leaves every year (k = 1 / Lifetime). Same form as the IPCC decay for harvested wood products; see the note below the table |
LandfillDecayWood |
condition = Dry, Wet, or Managed
|
decay of wood in landfills |
LandfillDecayPaper |
condition = Dry, Wet, or Managed
|
decay of paper in landfills |
Write parameters as name=value, separated by commas when there are several, for example stddev=1 or
shape=2.5, scale=40.
Note on Simple. Simple is a first-order decay function with a lifetime you choose. The share of an inflow
still in stock after t years is e^(−t / Lifetime), so the same share of the remaining stock leaves every year.
- Lifetime is the mean lifetime, not the half-life. If your data give a half-life (as the IPCC does), convert it: Lifetime = half-life / ln(2) ≈ 1.44 × half-life, for example a half-life of 35 years → Lifetime 50.
- Lifetime is a whole number and decimals are cut off (2.9 becomes 2), so round the converted value yourself.
-
Simplehas the same form as the IPCC first-order decay for harvested wood products, but it does not reproduce the IPCC values exactly: aiphoria adds the whole inflow of a year to the stock at once, while the IPCC equation spreads it over the year. The difference in stock is roughly 1 / (2 × Lifetime): about 0.5% for a lifetime of 100 years, 1% for 50 years, 5% for 10 years, and around 20% for 2–3 years.
Lifetimes can change during the simulation (for example because buildings last longer in the future): see Stock lifetime overrides in Other sheets.
Normally, everything that enters a stock process is added to the stock. With prioritize_locations or
prioritize_transformation_stages in the Settings sheet, flows with a given location (for example Export) or
stage leave the process in the same year instead of entering the stock.
NOTE: this functionality supports a case that a flow e.g., trade flow instead of entering a stock process on a specific timestep/year, it skips it. That is useful in case when trade flows need to be represented in the system but should not be considered as part of the stock.
Next: Indicators