Repository navigation
Dashboard Card
The optional Taggle card shows today's use against your usual day, the last hour, the peak hour, your meter reading, an hourly chart for today, the previous 7 days, leak and street comparisons, and signal details. Standard Home Assistant sensor cards already work; installing this custom card is a separate step from the receiver add-on. This guide describes card 0.3.0 with receiver 0.3.0.
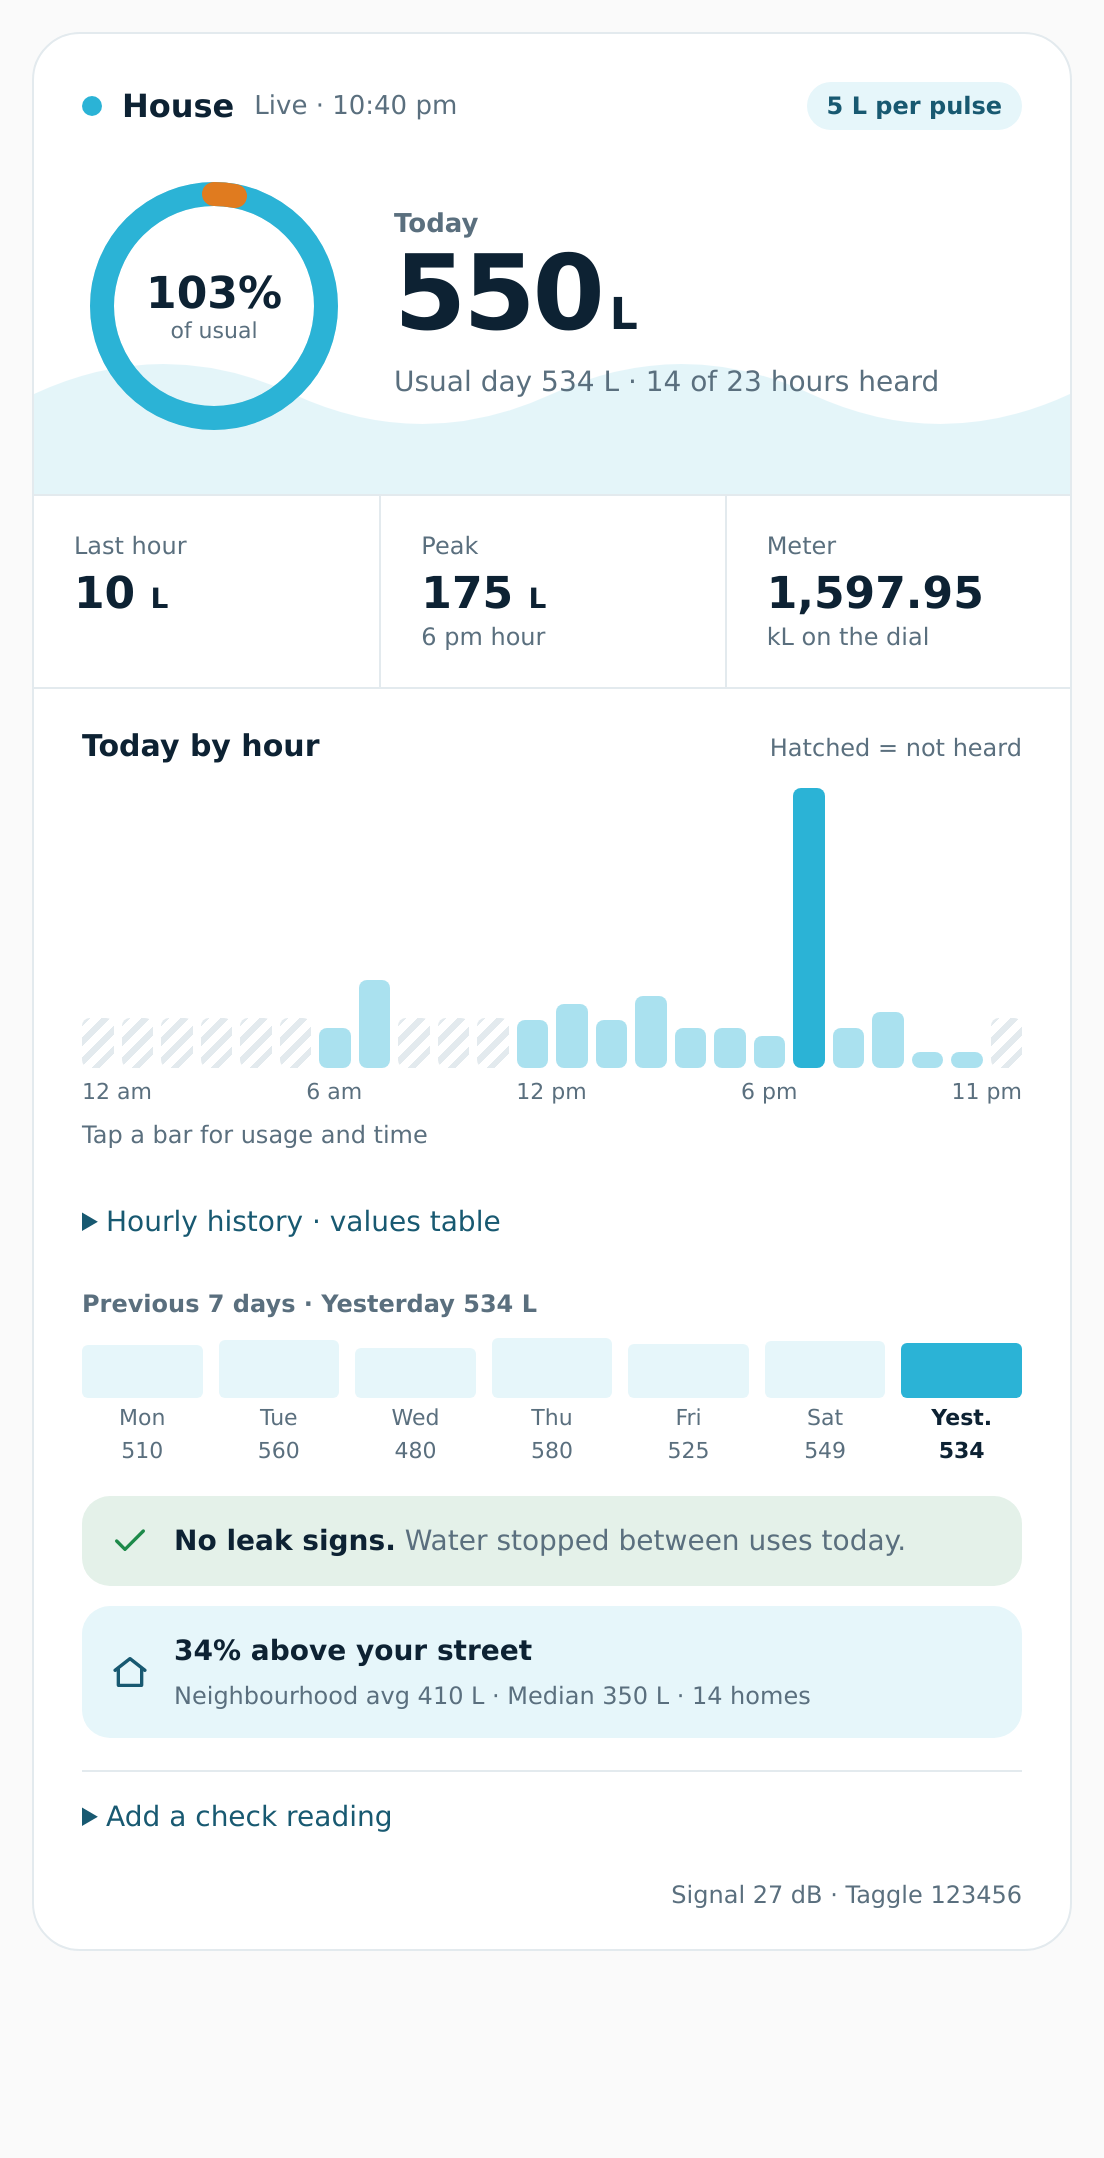
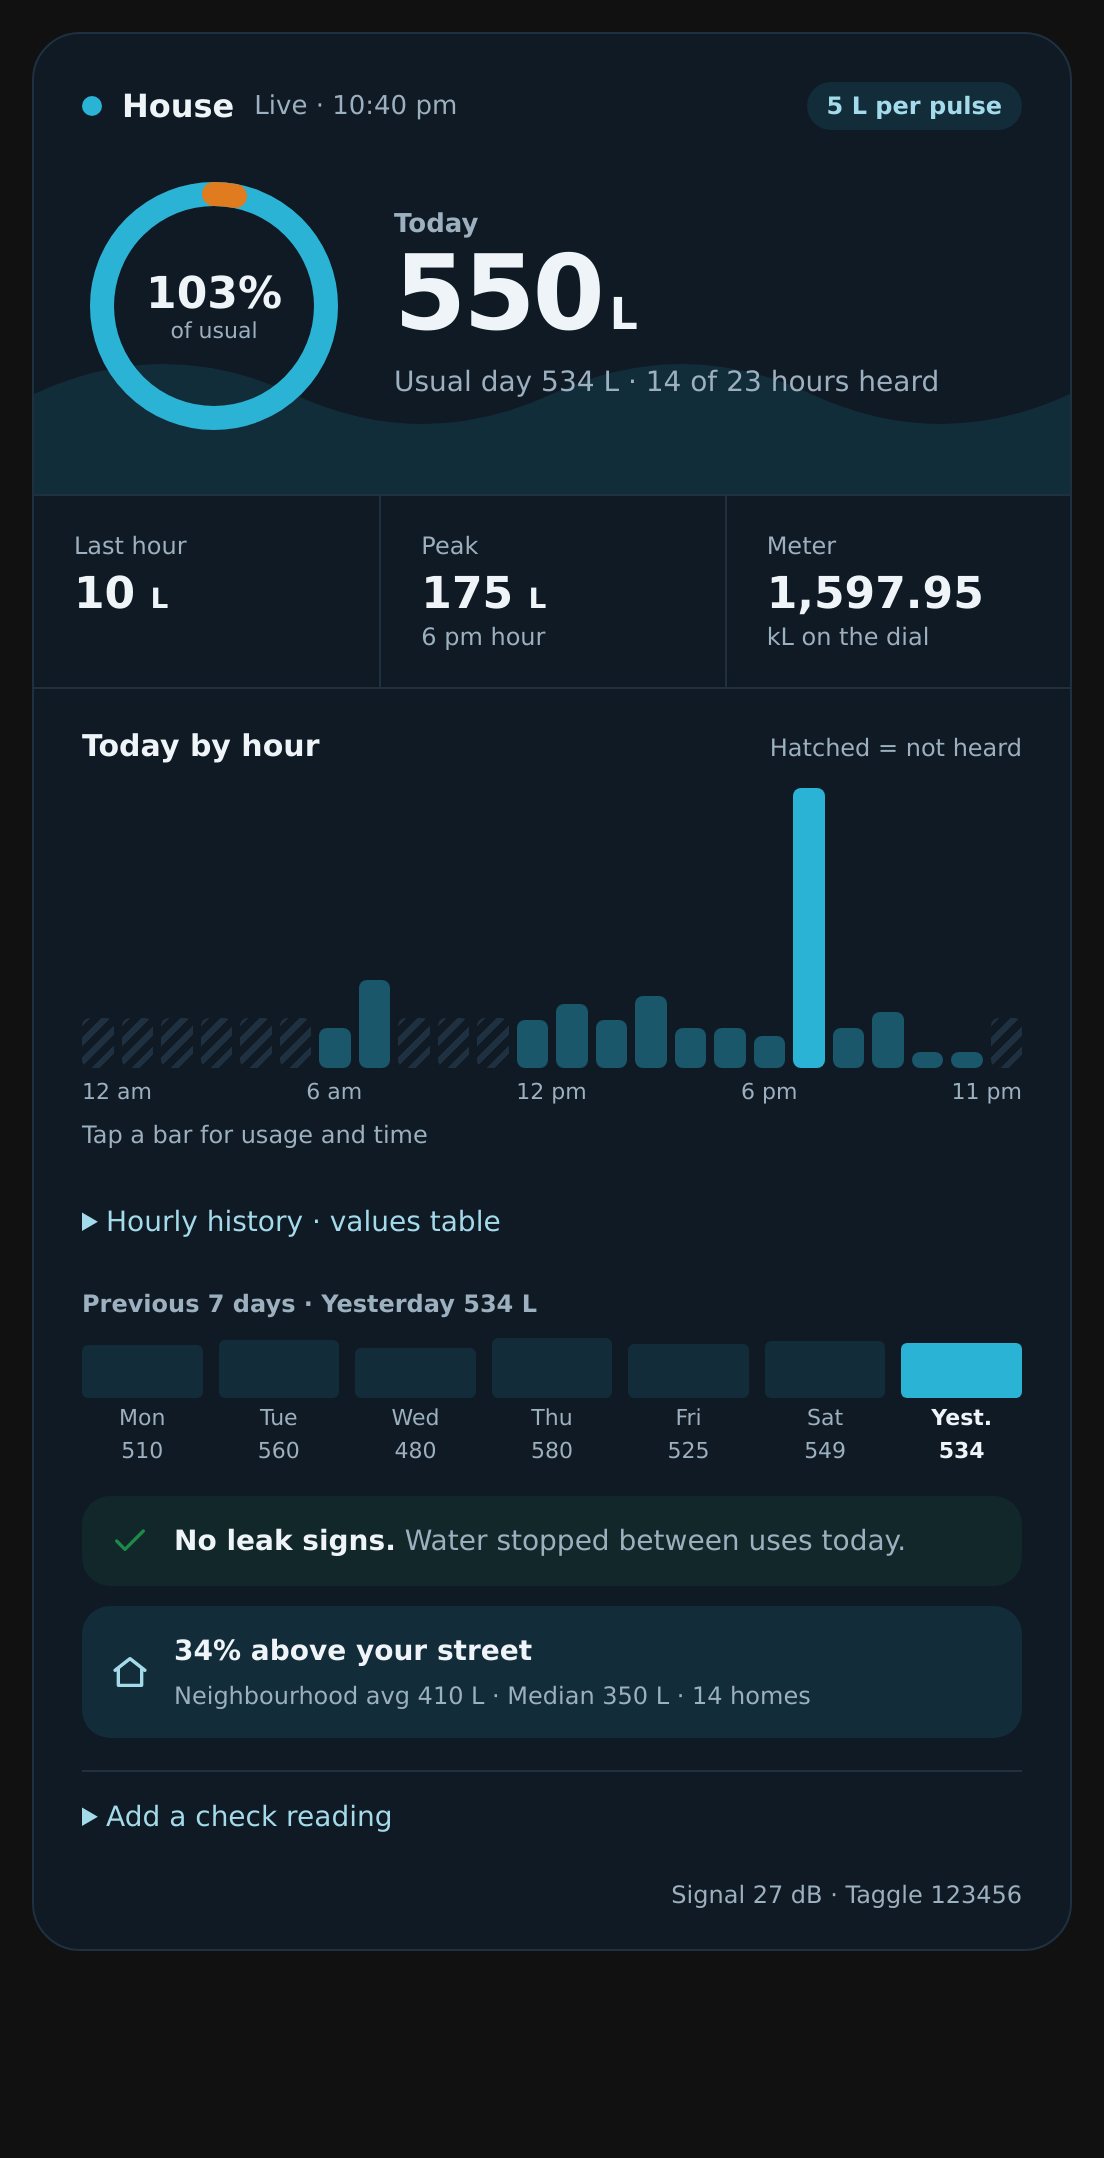
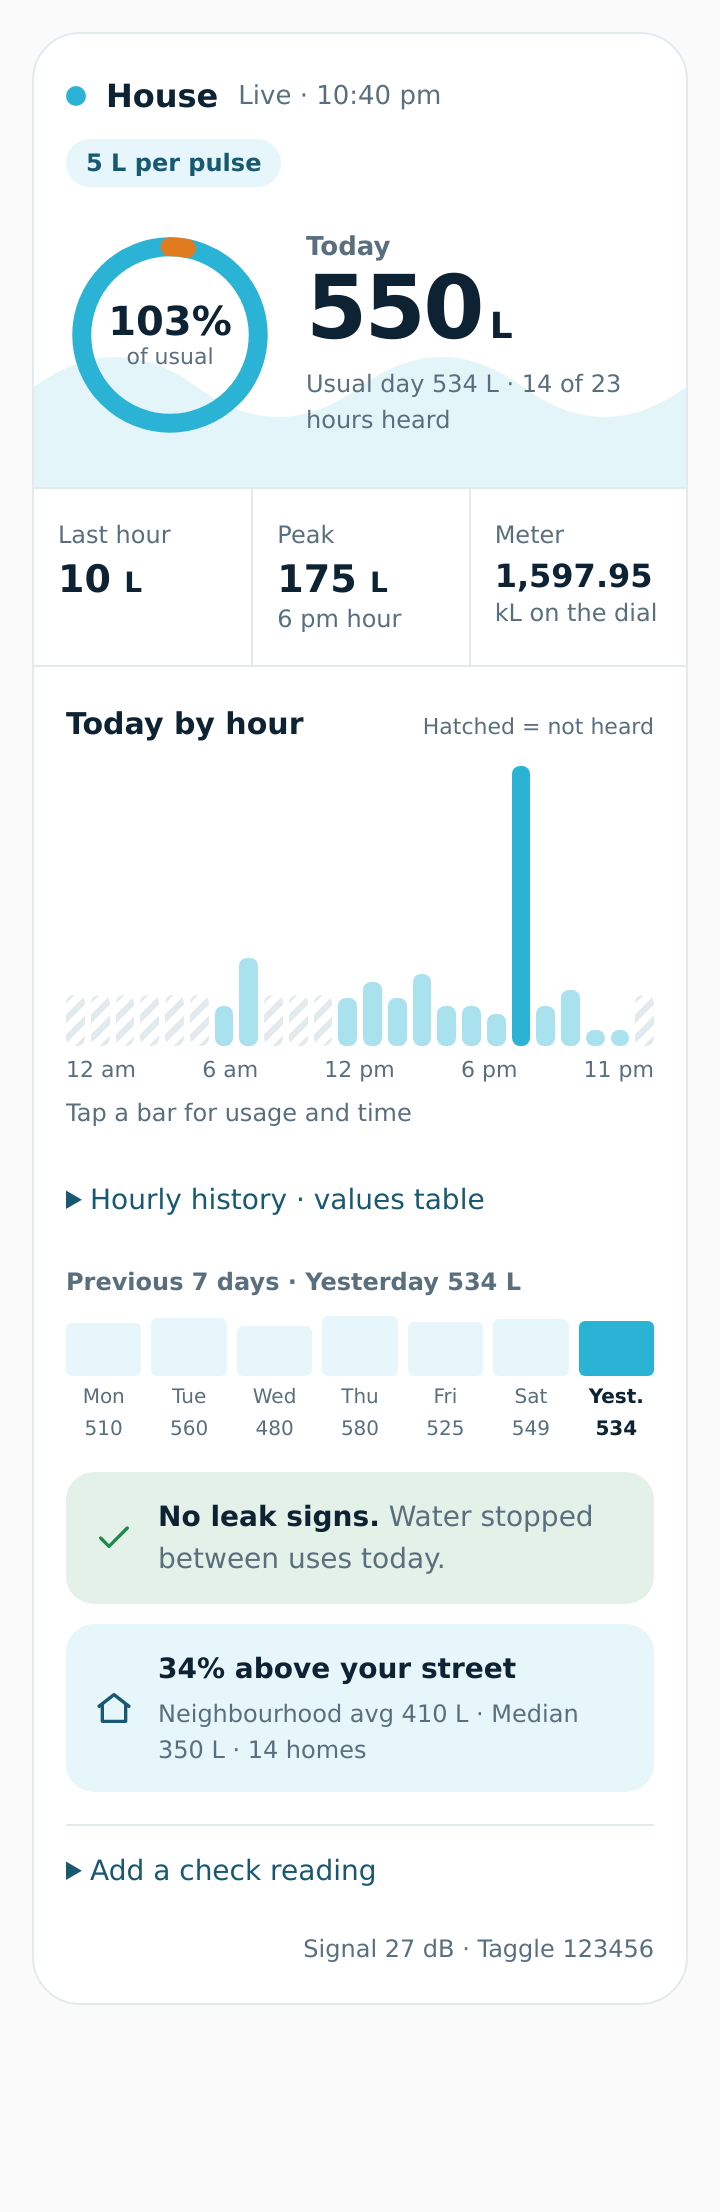
Example data showing the card after calibration, with litres enabled. These are fictional readings. Your first screen shows pulses until you measure litres per pulse.
What each part shows
| Part | What it means |
|---|---|
| Live dot and time | Pulses while a reading arrived in the last 75 minutes; otherwise shows when the meter was last heard |
| Ring and Today | Today's observed use against your usual day (average of the previous 7 recorded days, from Home Assistant history). Over 100% shows an orange tip. On a new install it says Learning your usual day for the first week |
| Last hour · Peak · Meter | The newest hourly use, today's biggest hour, and the calibrated meter reading as it should appear on your dial (before calibration: the pulse count) |
| Today by hour | One bar per hour of the local day; the peak is highlighted and hatched bars mean not heard (missing is never shown as zero). Tap or focus a bar for its value and time |
| Previous 7 days | Daily totals with yesterday called out |
| Leak and street rows | The possible-leak hint and the anonymous neighbourhood comparison once 3 homes qualify |
It follows your Home Assistant theme (light or dark) and turns off its animations when your device asks for reduced motion. The same design is shown on the project website.
Tip
What you'll need
- ha-taggle running, with your meter's entities in Home Assistant
- A way to access Home Assistant files, using the browser-only steps below or an existing HACS installation
HACS, the Home Assistant Community Store, installs custom dashboard cards and integrations. It is separate from Home Assistant's add-on/app Store. If you do not have it, the manual browser route below needs no HACS. Alternatively, follow Downloading HACS, then its Initial configuration step before returning here. Downloading alone does not add HACS to the sidebar.
The easy way:

The manual way:
- Open HACS.
- Click ⋮ (top right) → Custom repositories.
- Paste
https://github.com/Spicynostalgia/ha-taggle, choose type Dashboard, and click Add. See HACS custom repositories. - Search HACS for ha-taggle, open it and click Download, selecting release v0.3.0 to match this guide.
- Reload your browser when asked.
First find Home Assistant's configuration directory, the one containing configuration.yaml. On Container, it is the host directory mapped to HA's /config, not necessarily a folder named config and not the receiver's checkout.
Home Assistant OS, using only your browser:
- In Settings → Apps (Add-ons) → Store, install File editor. On Info, click Start, then Open Web UI. Its default base folder is HA's configuration directory. HA's OS common tasks page covers file access too; find “Configuring access to files” on that page.
- Open the folder browser. In the folder containing
configuration.yaml, create a folder namedwwwif absent. Openwwwand createtaggle-card.js. - Open the linked card file below, select v0.3.0 with GitHub's tag selector, then choose Raw. Copy the JavaScript into the empty
taggle-card.jsin File editor and Save. Leaveconfiguration.yamlalone.
If you already have file access:
- Open
dist/taggle-card.js, select tag v0.3.0, and choose Download raw file. Do not save the GitHub HTML page. - Save it as
www/taggle-card.jsinside HA's configuration directory, without.txtor.html. Createwwwif absent. The first line identifies the card version (Taggle card 0.3.0).
Finish either manual route:
- After first creating
www, restart Home Assistant once (use its restart action; for Container, restart your existing HA container). Files there are served under/local/only after this restart. - On your own HA instance, visit
/local/taggle-card.js. It should show JavaScript, not a 404 or GitHub HTML. This is a path on your HA server, not an external download link. - Go to Settings → Dashboards → ⋮ → Resources → Add resource. Enable Advanced Mode in your user profile if Resources is hidden.
- URL:
/local/taggle-card.js?v=0.3.0. Type: JavaScript module. Save the resource. - Reload your browser, then continue with Add the card below.
Tip
Why ?v=0.3.0? Browsers cache files. Changing the number after you update the file forces a fresh download. HA's resource docs recommend the same trick.
HACS installs the committed dist/taggle-card.js; no frontend build or dependencies are needed. Publishing a GitHub release enables versioned installation.
- Open your dashboard → ✏️ Edit dashboard → Add card.
- Scroll to Manual (or search "Taggle water meter").
- Paste an example below, preserving indentation. Replace every
123456with your transmitter ID. Copy actual entity IDs if they differ from these defaults; friendly sensor names are not entity IDs. - Save.
Note
Card 0.3.0 shows “Waiting for first reading (can take up to an hour)” for a new meter. Confirm receiver startup and MQTT discovery, then allow an hourly transmission. A previously observed meter keeps warnings when reception fails. Confirmed encrypted messages cannot provide usage.
type: custom:taggle-card
title: Water usage
entities:
  last_hour: sensor.taggle_123456_last_hour
  today: sensor.taggle_123456_today
  meter_count: sensor.taggle_123456_meter_count
  last_seen: sensor.taggle_123456_last_seen
  snr: sensor.taggle_123456_snr
  signal_level: sensor.taggle_123456_signal_level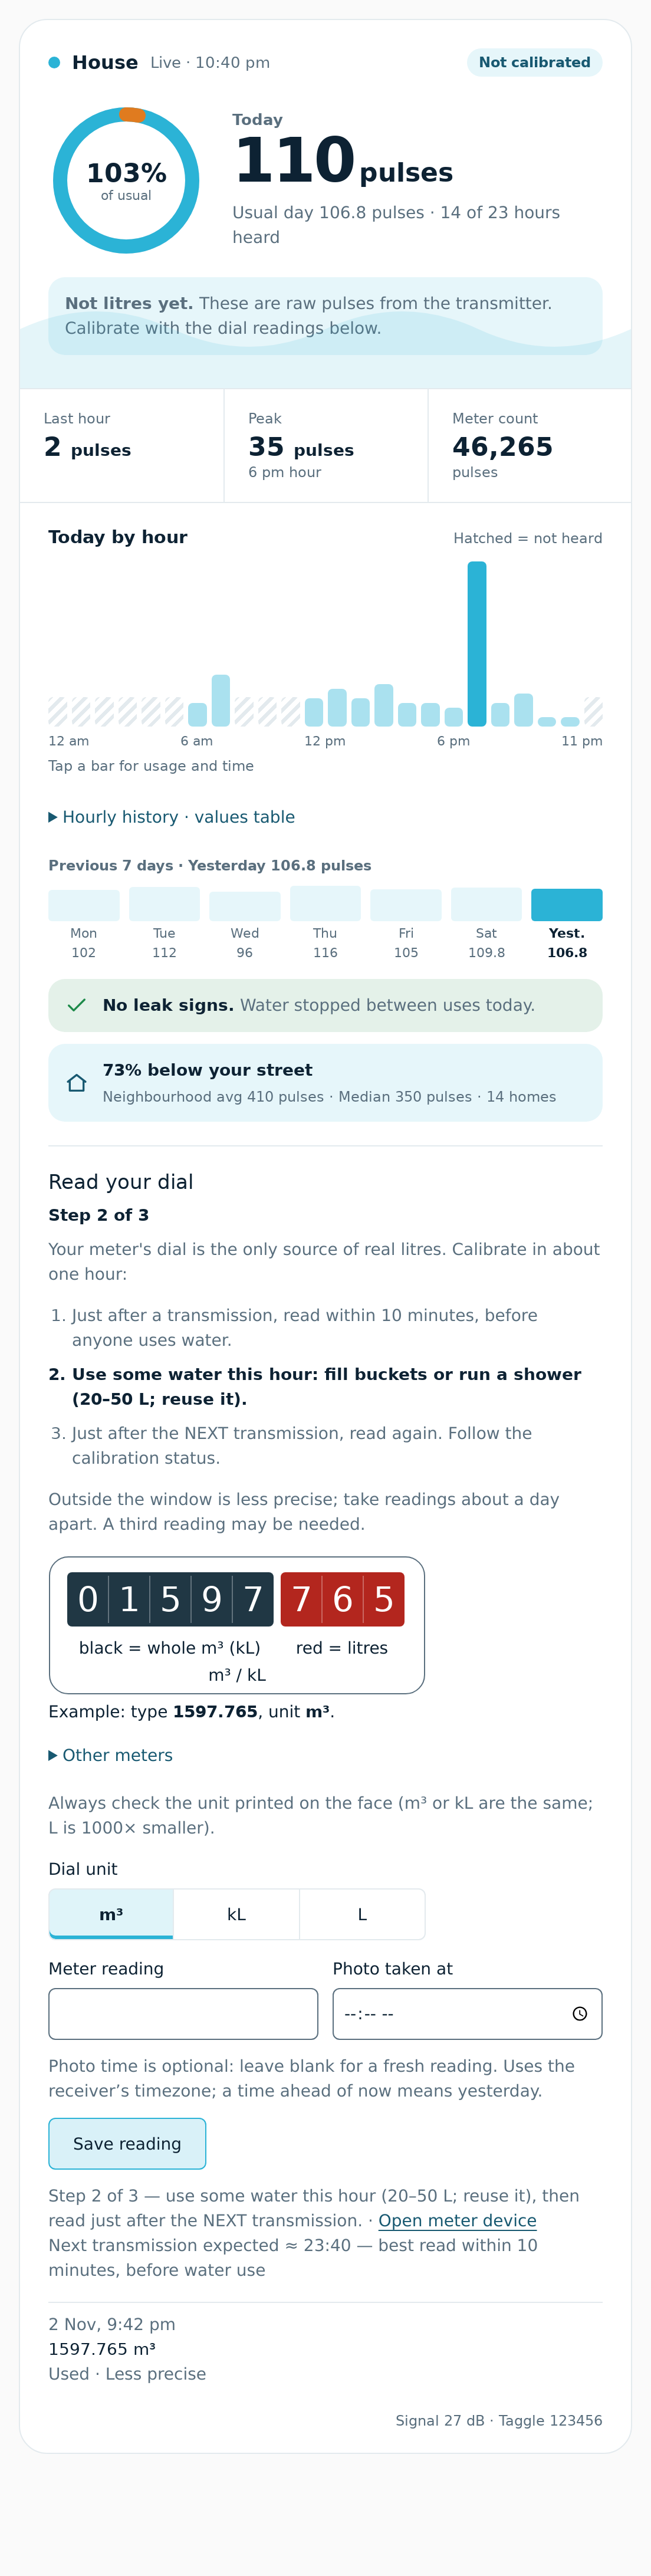
0.3.0 calibration panel with fictional data. The register picture is an illustration; read the units on your physical meter.
Not litres yet. Before calibration the card explicitly labels usage as raw pulses. Its Read your dial panel stays visible until calibrated, shows a three-step routine and a Read now countdown, and offers expandable Other meters help. Read within ten minutes after a transmission, use about 20–50 L during the hour (reuse it), then read just after the next transmission. Follow Calibration status if more evidence is needed.
Choose the unit m³, kL or L, enter the complete Meter reading and optionally Photo taken at, then save promptly. Leave photo time blank for a fresh reading. The form combines both fields into the single Dial reading command (1597.765 or 1597.765 18:00), preserving typed decimals. Clock times use the receiver’s timezone; one ahead of now means yesterday. There is no pending photo time to affect the next reading.
The panel lists the last ten readings, including time, value/unit, exactness and used/excluded/pending status. Reading sent confirms dispatch; check receiver status for acceptance. Outside the read-now window entries remain accepted but are less precise and may need a third reading. Once calibrated the panel collapses to Add a check reading; warnings reopen it. It preserves unsent entries and keyboard focus during HA updates. Missing or unavailable controls disable saving with an explanation.
Device mode discovers the controls, including renamed entities. Existing pulse maps also acquire calibration and litre entities automatically when registry lookup identifies the same device. If registry lookup is unavailable, append these keys to your existing entities: map using actual entity IDs:
entities:
  # Keep the usage mappings above, then add:
  calibration_status: sensor.taggle_123456_calibration_status
  dial_unit: select.taggle_123456_dial_unit
  dial_reading: text.taggle_123456_dial_reading
  read_dial_now: binary_sensor.taggle_123456_read_dial_now
See Calibration for dial help, phone reminders, corrections and reset consequences. Controls on the MQTT device page work without the card too.
When binary_sensor.taggle_123456_possible_leak is ON, the card shows Possible leak with its reason. Device cards find it through the registry, including renames; for explicit maps append possible_leak: binary_sensor.taggle_123456_possible_leak, or add the binary sensor to an entity list. OFF, unknown, unavailable and missing sensors show no badge. This is an hourly hint, not a confirmed leak or instant alarm. Leak detection explains rules and recovery.
After guided calibration, the receiver publishes litre entities automatically and supplies an estimated Meter reading once the absolute counter and offset are resolved. Default pulse maps acquire these entities automatically in 0.3.0, including renamed entities when registry lookup identifies the device. If custom IDs cannot be resolved, explicitly map the litre and calibration entities as below. Device mode resolves them from the registry.
type: custom:taggle-card
title: Water usage
entities:
  last_hour: sensor.taggle_123456_last_hour
  today: sensor.taggle_123456_today
  meter_count: sensor.taggle_123456_meter_count
  last_seen: sensor.taggle_123456_last_seen
  snr: sensor.taggle_123456_snr
  signal_level: sensor.taggle_123456_signal_level
  last_hour_litres: sensor.taggle_123456_last_hour_litres
  today_litres: sensor.taggle_123456_today_litres
  total_litres: sensor.taggle_123456_total_litres
  meter_reading: sensor.taggle_123456_meter_reading
  calibration_status: sensor.taggle_123456_calibration_status
possible_leak: binary_sensor.taggle_123456_possible_leakUse the Home Assistant device ID, not the transmitter number. To find it, open the device page under Settings → Devices & services → Devices. The long ID is at the end of the page address: /config/devices/device/<device-id> on your own HA server. Copy only the final long identifier, not 123456 or the friendly device name. Replace the placeholder in this example before saving.
type: custom:taggle-card
device: your-home-assistant-device-id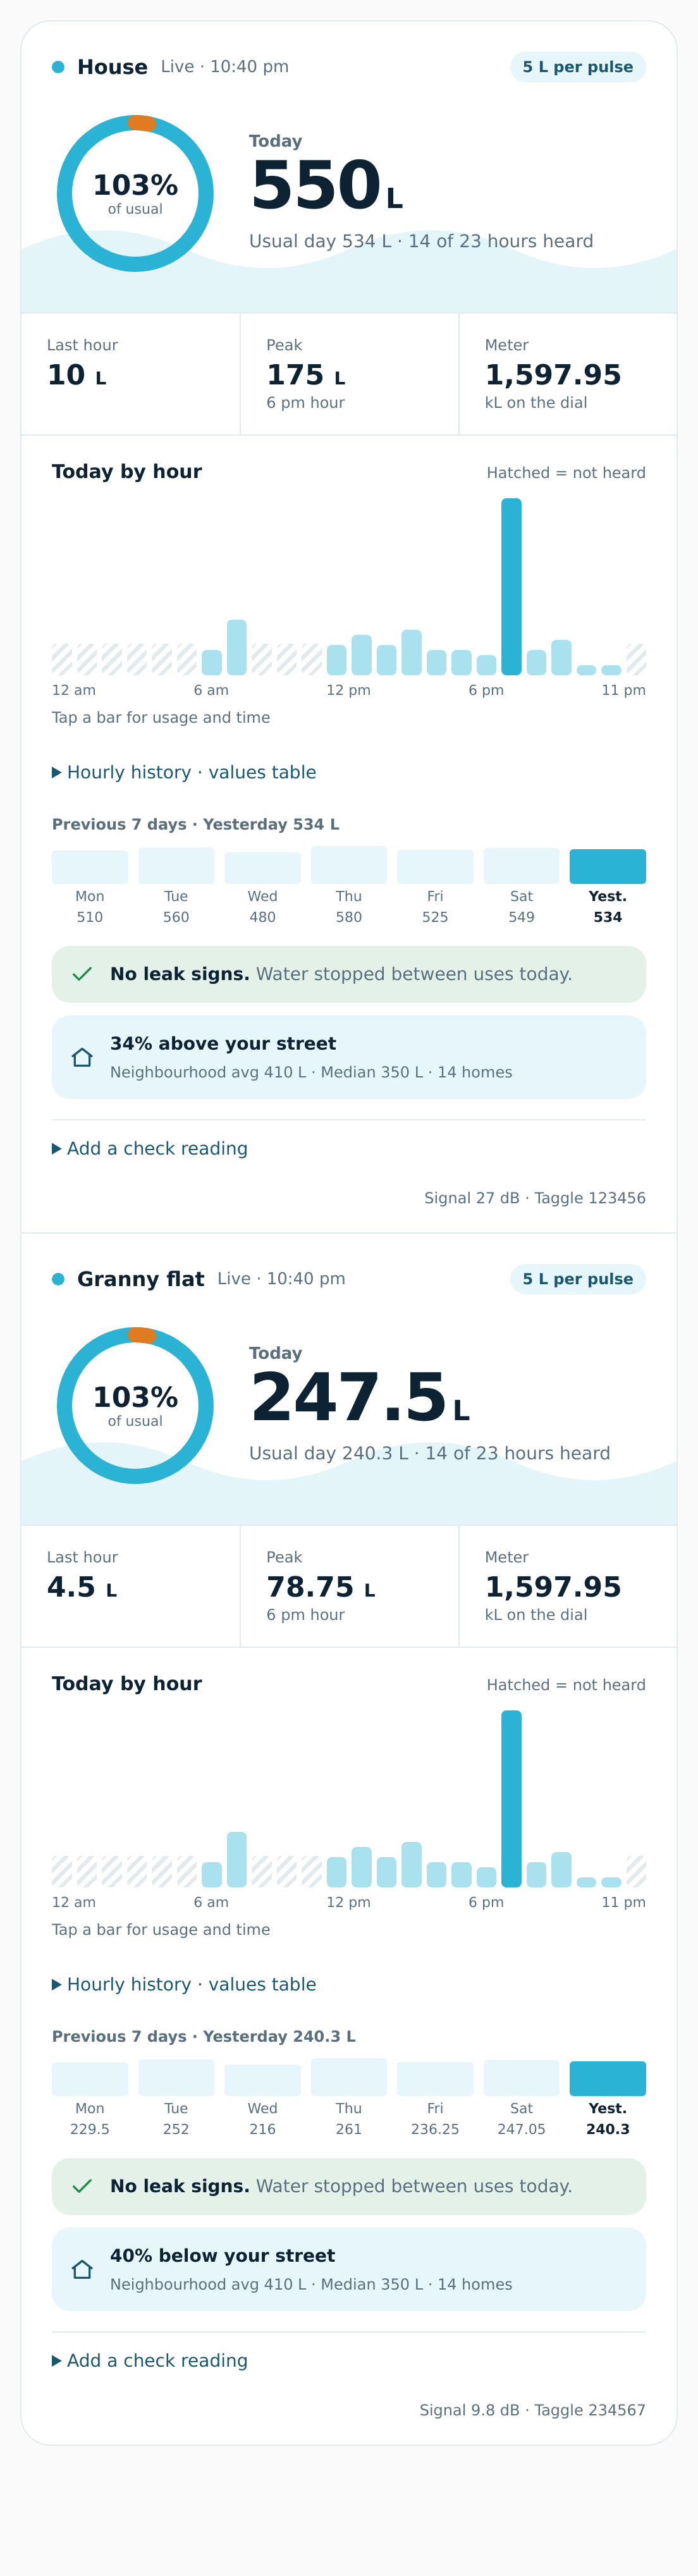
type: custom:taggle-card
title: Water usage
meters:
  - name: House
    entities:
      last_hour: sensor.taggle_123456_last_hour
      today: sensor.taggle_123456_today
      meter_count: sensor.taggle_123456_meter_count
      last_seen: sensor.taggle_123456_last_seen
  - name: Granny flat
    device: your-second-home-assistant-device-registry-id
Example data with fictional meters. The second YAML entry uses its HA device registry ID so each entry selects a different configured meter.
The card adds a comparison line once the neighbourhood sensors exist. It finds sensor.taggle_neighbourhood_average_today, _median_today and _meters_counted automatically. Until enough meters qualify, it shows "waiting for enough qualifying homes". That built-in label counts meters, not verified households.
If you renamed those sensors:
type: custom:taggle-card
entities:
  last_hour: sensor.taggle_123456_last_hour
  today: sensor.taggle_123456_today
neighbourhood:
  average_today: sensor.my_neighbourhood_average
  median_today: sensor.my_neighbourhood_median
  meters_counted: sensor.my_neighbourhood_count
The neighbourhood map can sit at card level or inside each meter. You can also use neighbourhood: {device: your-neighbourhood-device-registry-id}; registry unique IDs resolve renamed neighbourhood sensors. The row shows your observed today, the average, median, qualifying meters and percentage above/below when units match. The history chart remains your meter's observed intervals.
To hide the row, add neighbourhood: false to the card. That only hides it. To stop collecting, turn off the receiver option too.
| Option | Meaning |
|---|---|
title |
Card heading (default "Water usage") |
entities |
Map of keys to entity IDs: last_hour, today, meter_count, last_seen, snr, signal_level, last_hour_litres, today_litres, total_litres, meter_reading, calibration_status, dial_unit, dial_reading, read_dial_now, possible_leak
|
device |
Home Assistant device ID, instead of entities
|
meters |
A list of {name, entities} or {name, device} for several meters |
neighbourhood |
false to hide, a map of entity IDs, or {device: ...}
|
Note
Why are some chart bars dashed? They mark hourly intervals that have not been recovered. A later frame can recover a single missed transmission; longer gaps can remain incomplete. A solid zero mark means observed zero use. The card does not guess missing usage.
MQTT discovery requests sensor.taggle_<id>_<key> and sensor.taggle_neighbourhood_<key> using default_entity_id. Defaults apply on first registration; existing registry IDs and user renames are preserved, and collisions can add a numeric suffix. An older installation may have name-derived IDs such as sensor.taggle_123456_water_today: use device mode or explicitly map the actual IDs. An entities list also works for default suggested entity names, as an alternative to the explicit map above.
The card follows Home Assistant's theme and timezone and uses its locale to format numbers and dates. Built-in labels and messages are currently English; you can set your own card title and meter names. It explicitly shows missing/unavailable values and provides a 48-hour chart with an accessible values table. It reads only authenticated Home Assistant states and its entity registry.
HACS users can choose a released update in HACS. Manual users replace www/taggle-card.js, update the resource's ?v= value and reload the browser cache. Check the version comment at the start of the downloaded JavaScript. Keep receiver and card versions consistent with the guide you are following; new features are not enabled by changing the cache number alone.