Usage
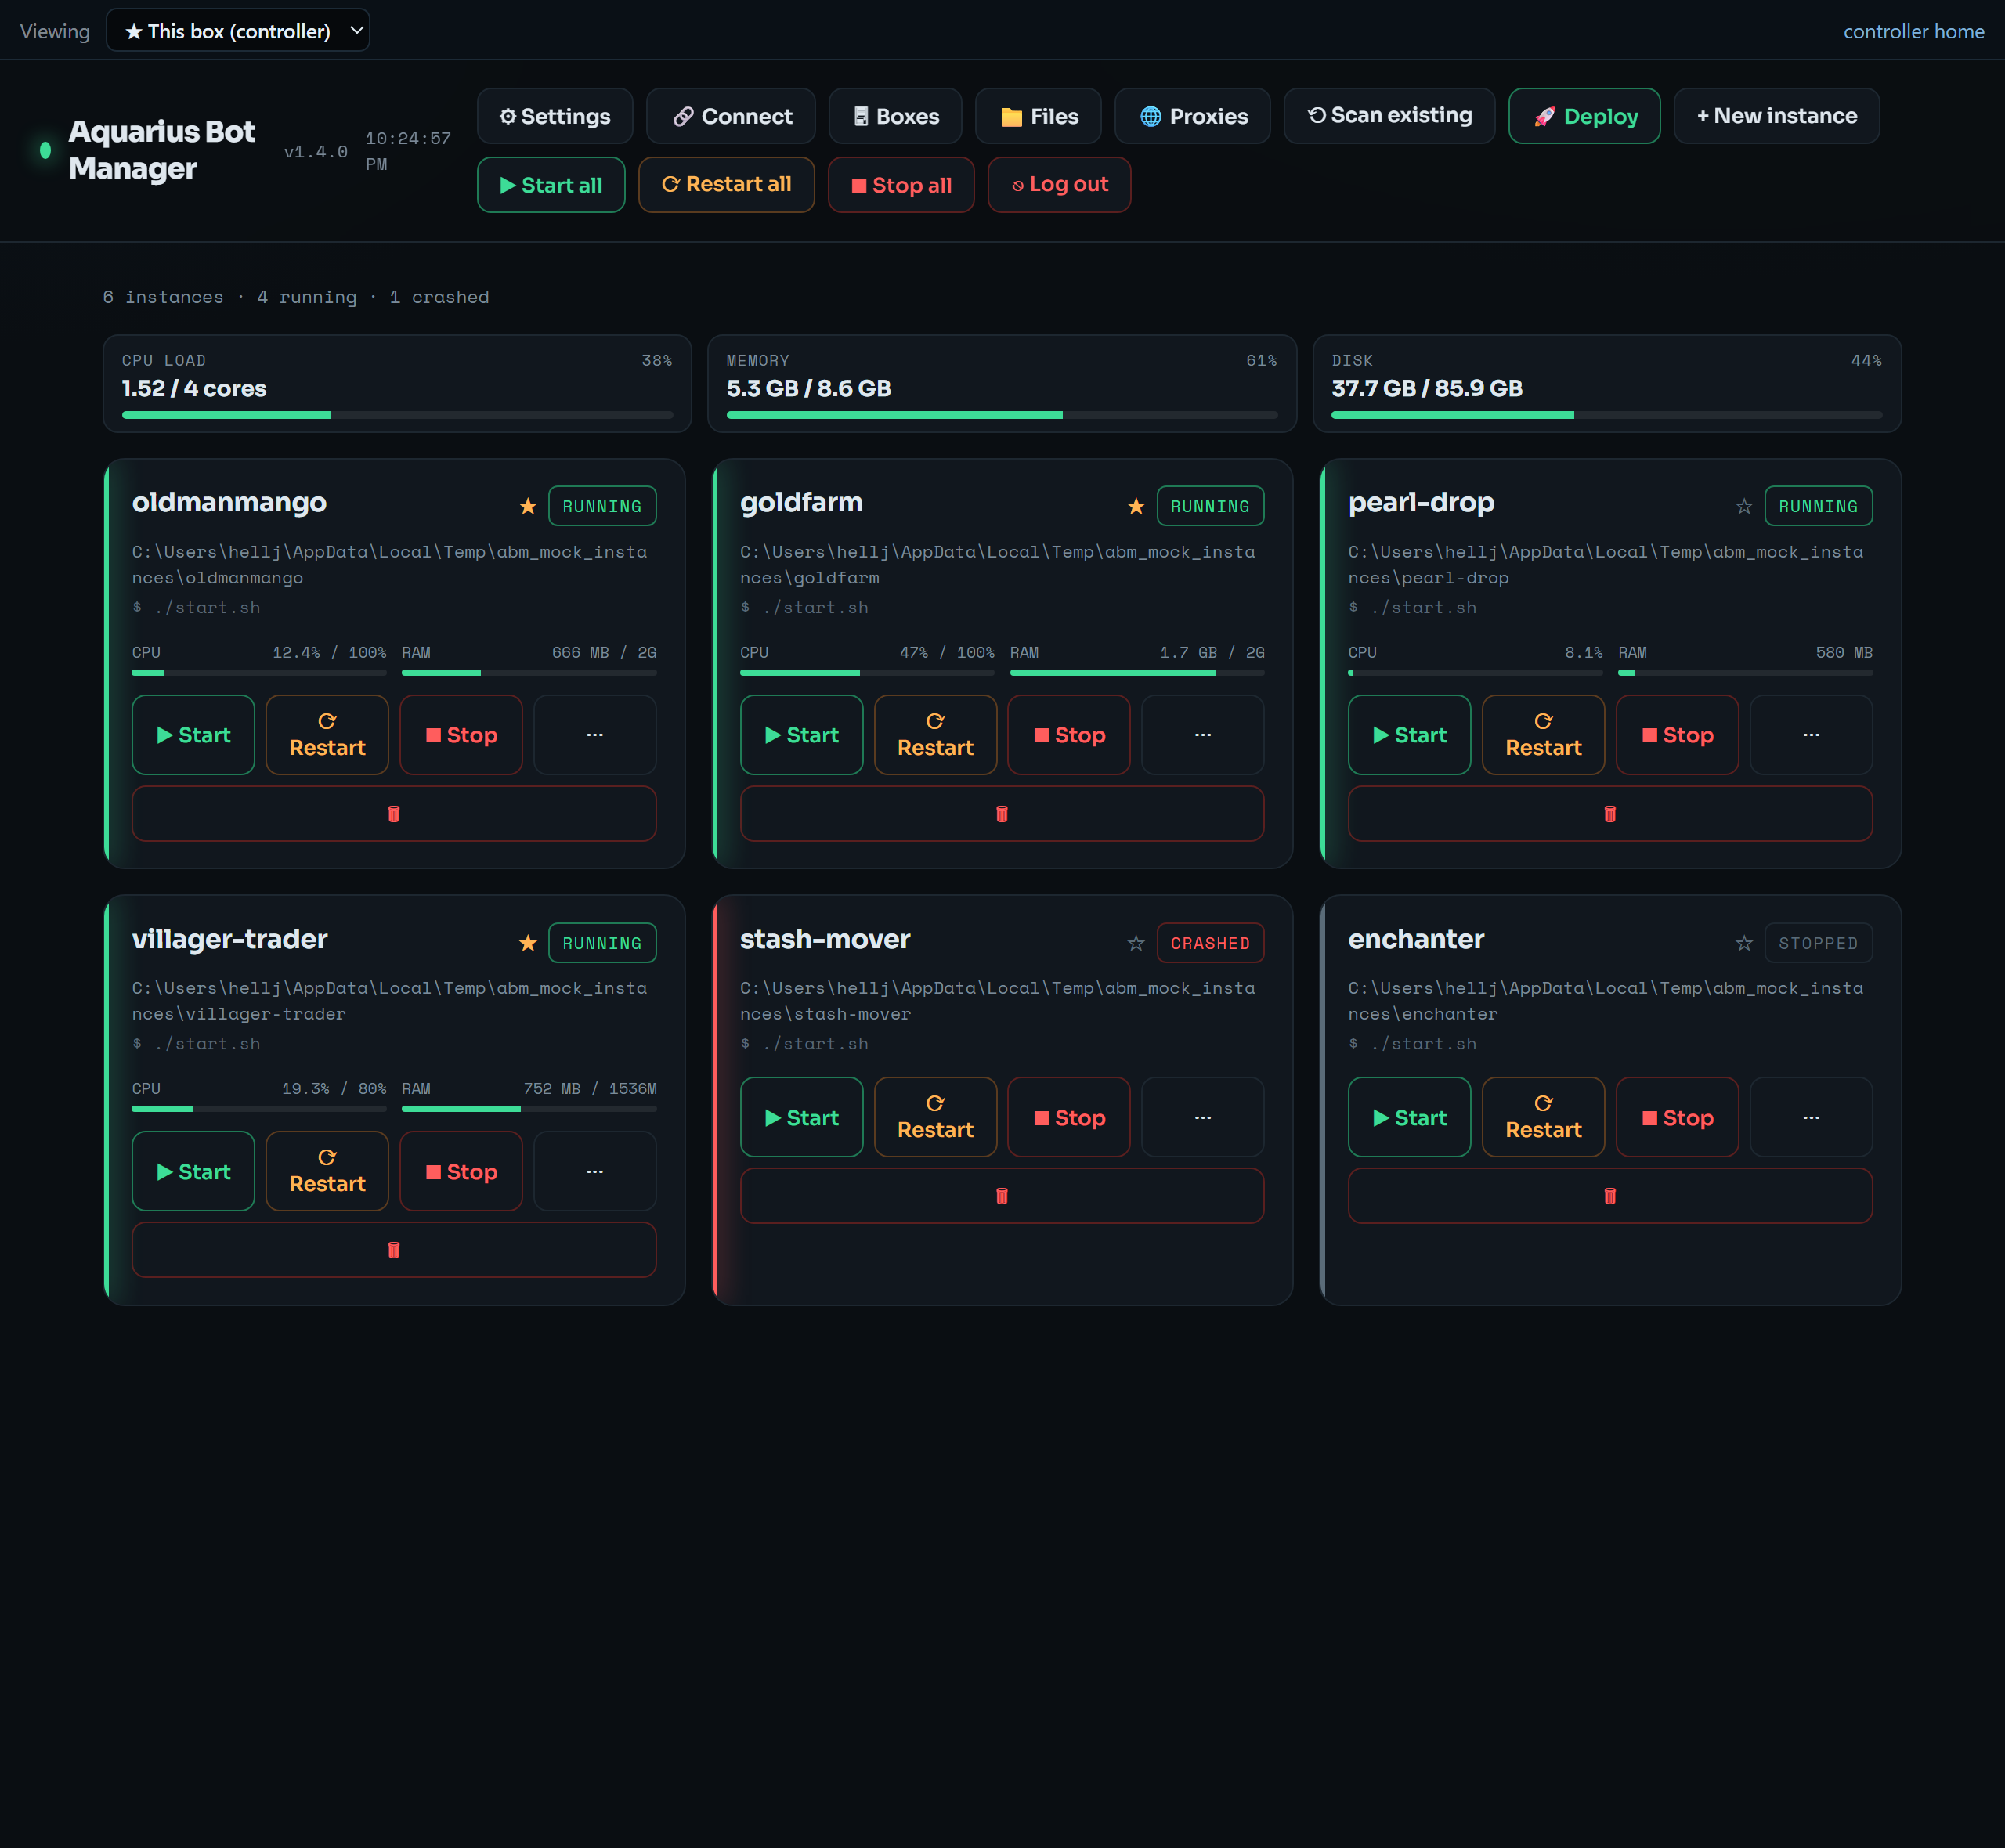
Open the web UI (see Installation). Top bar buttons:
- ⚙ Settings — appearance (themes/accent), monitoring thresholds, console presets, and the System tab (reboot / OS update toggle).
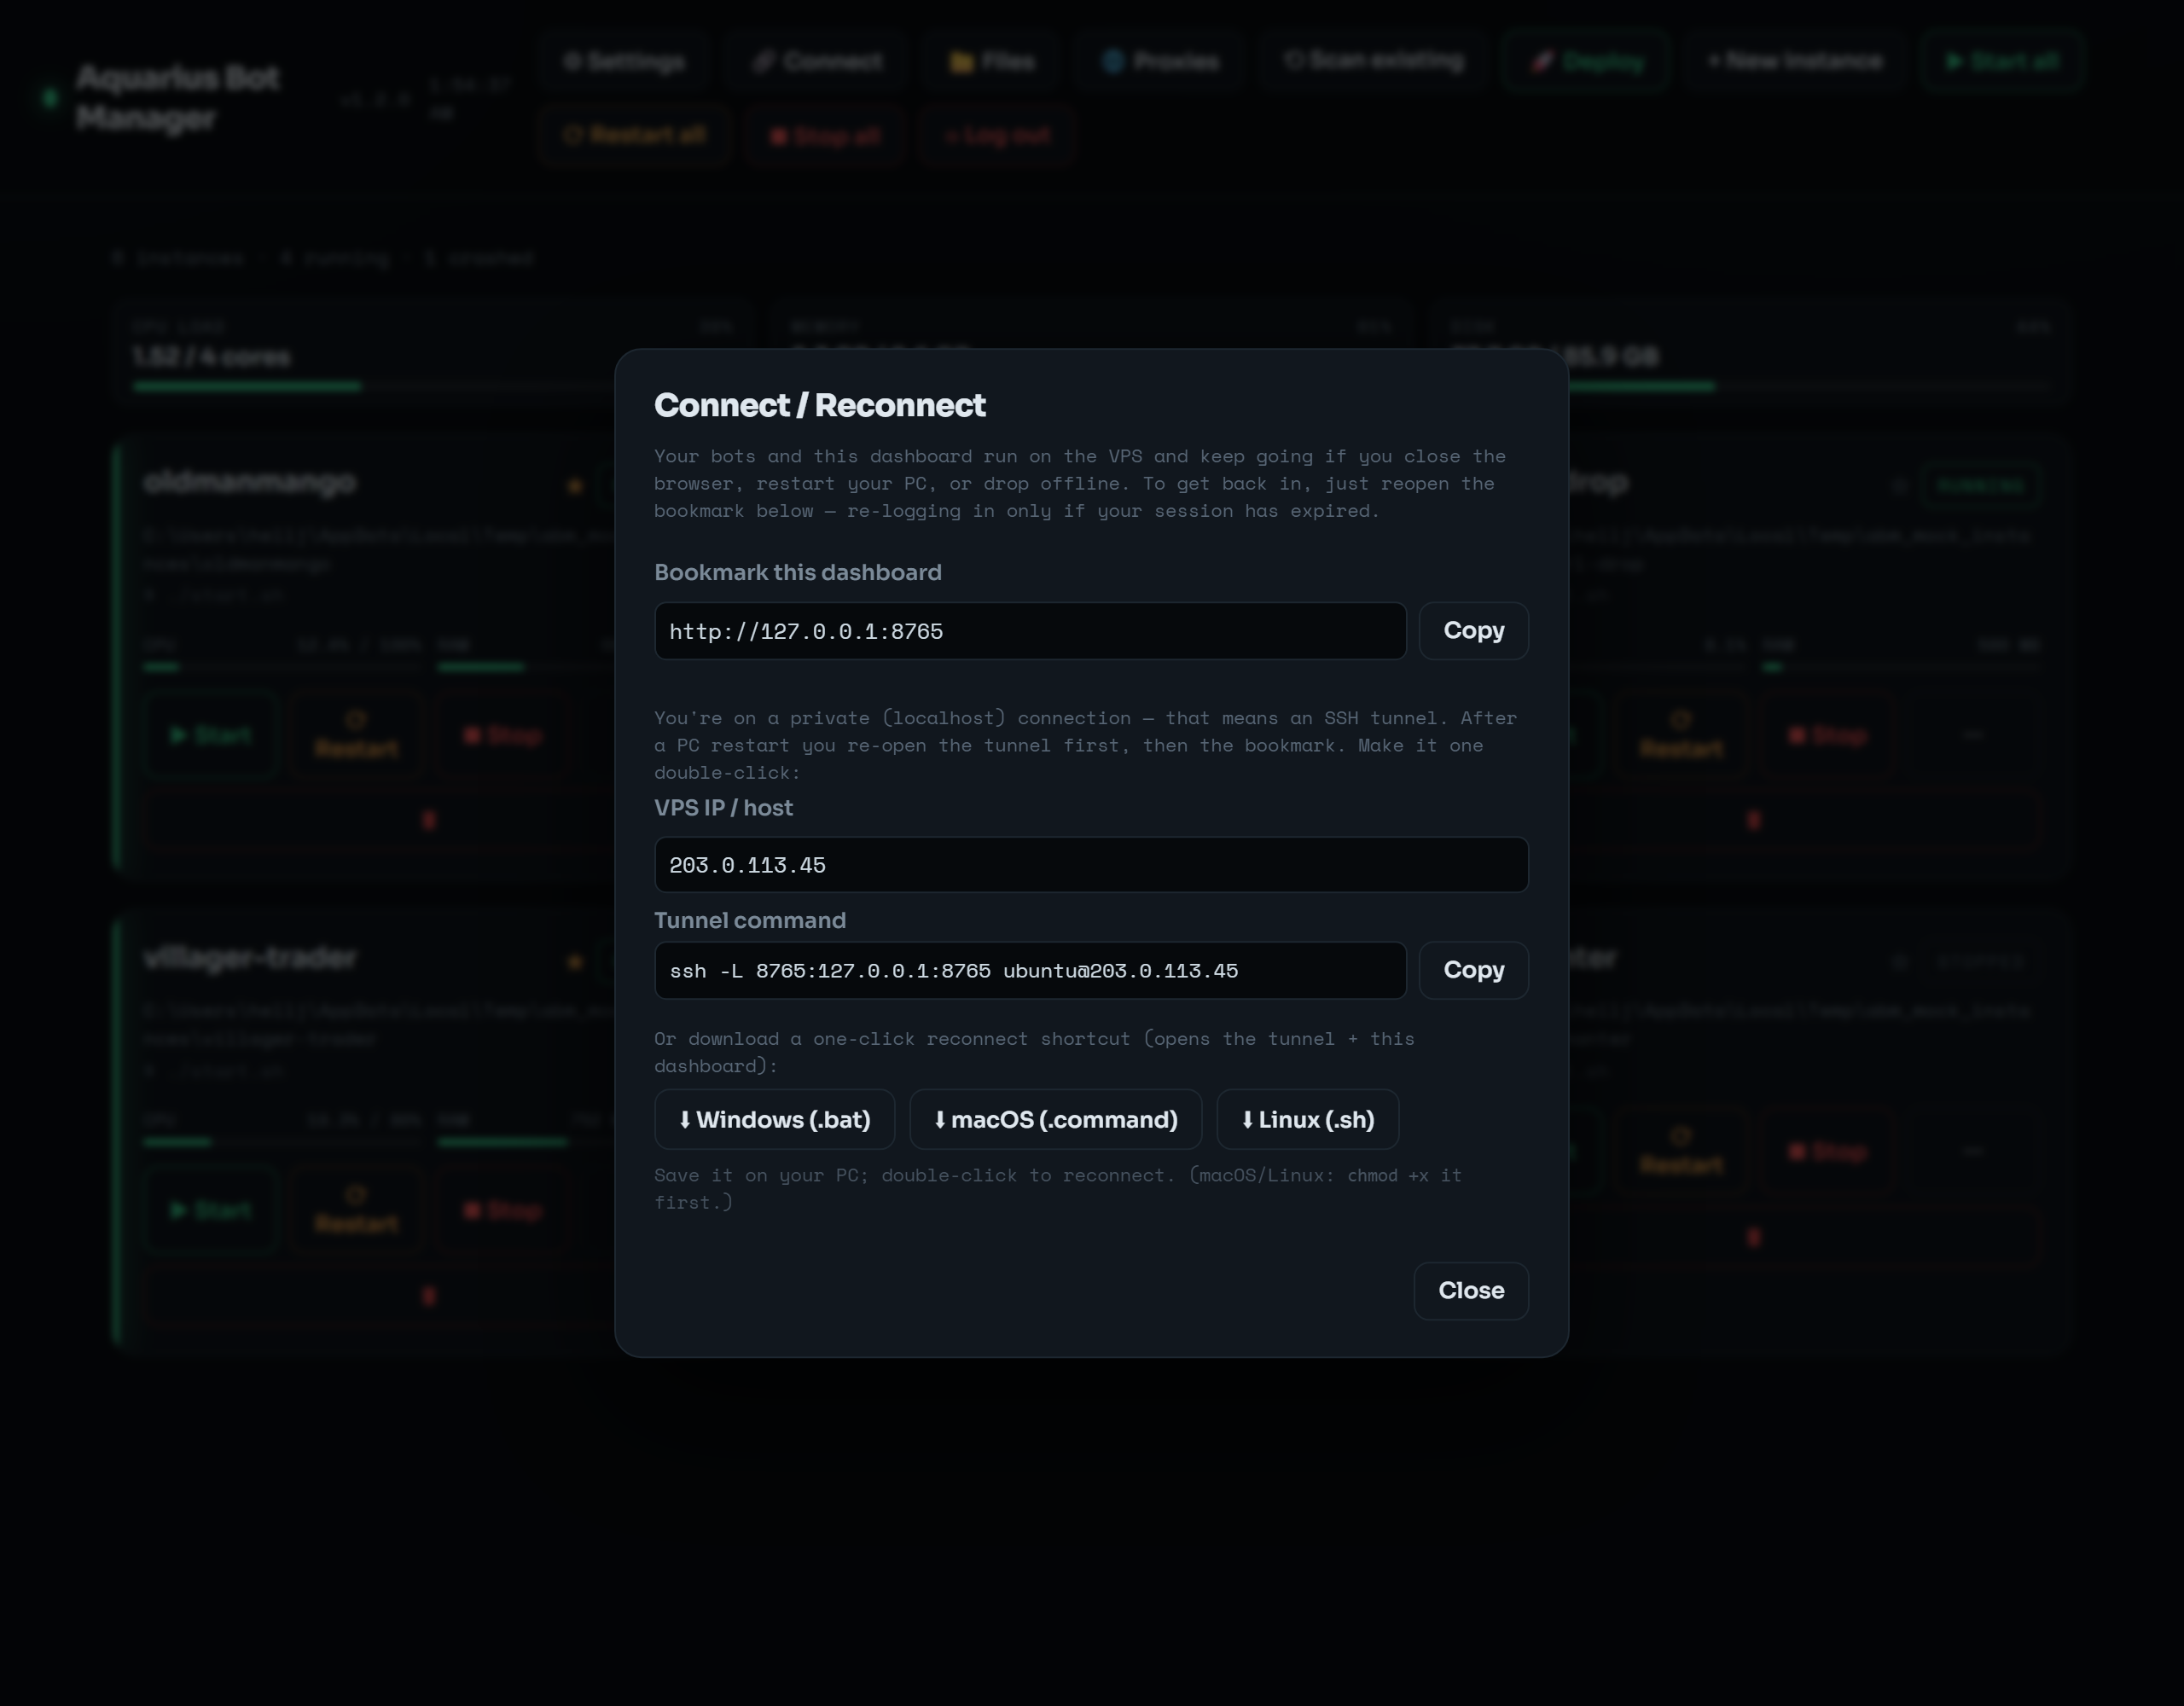
- 🔗 Connect — your bookmark URL, the SSH tunnel command, and a downloadable one-click reconnect shortcut. See Reconnecting below.
- 📁 Files — the jailed file manager (browse/edit/rename/delete within allowed roots).
- 🌐 Proxies — per-bot proxy editor, bulk assignment, and Webshare import. See Proxies.
-
⟲ Scan existing — detect
tmuxsessions you started by hand and adopt them. - 🚀 Deploy — stand up a new bot from a fork's launcher.
- + New instance — register an existing directory.
- ▶ Start all / ⟳ Restart all — bulk lifecycle.
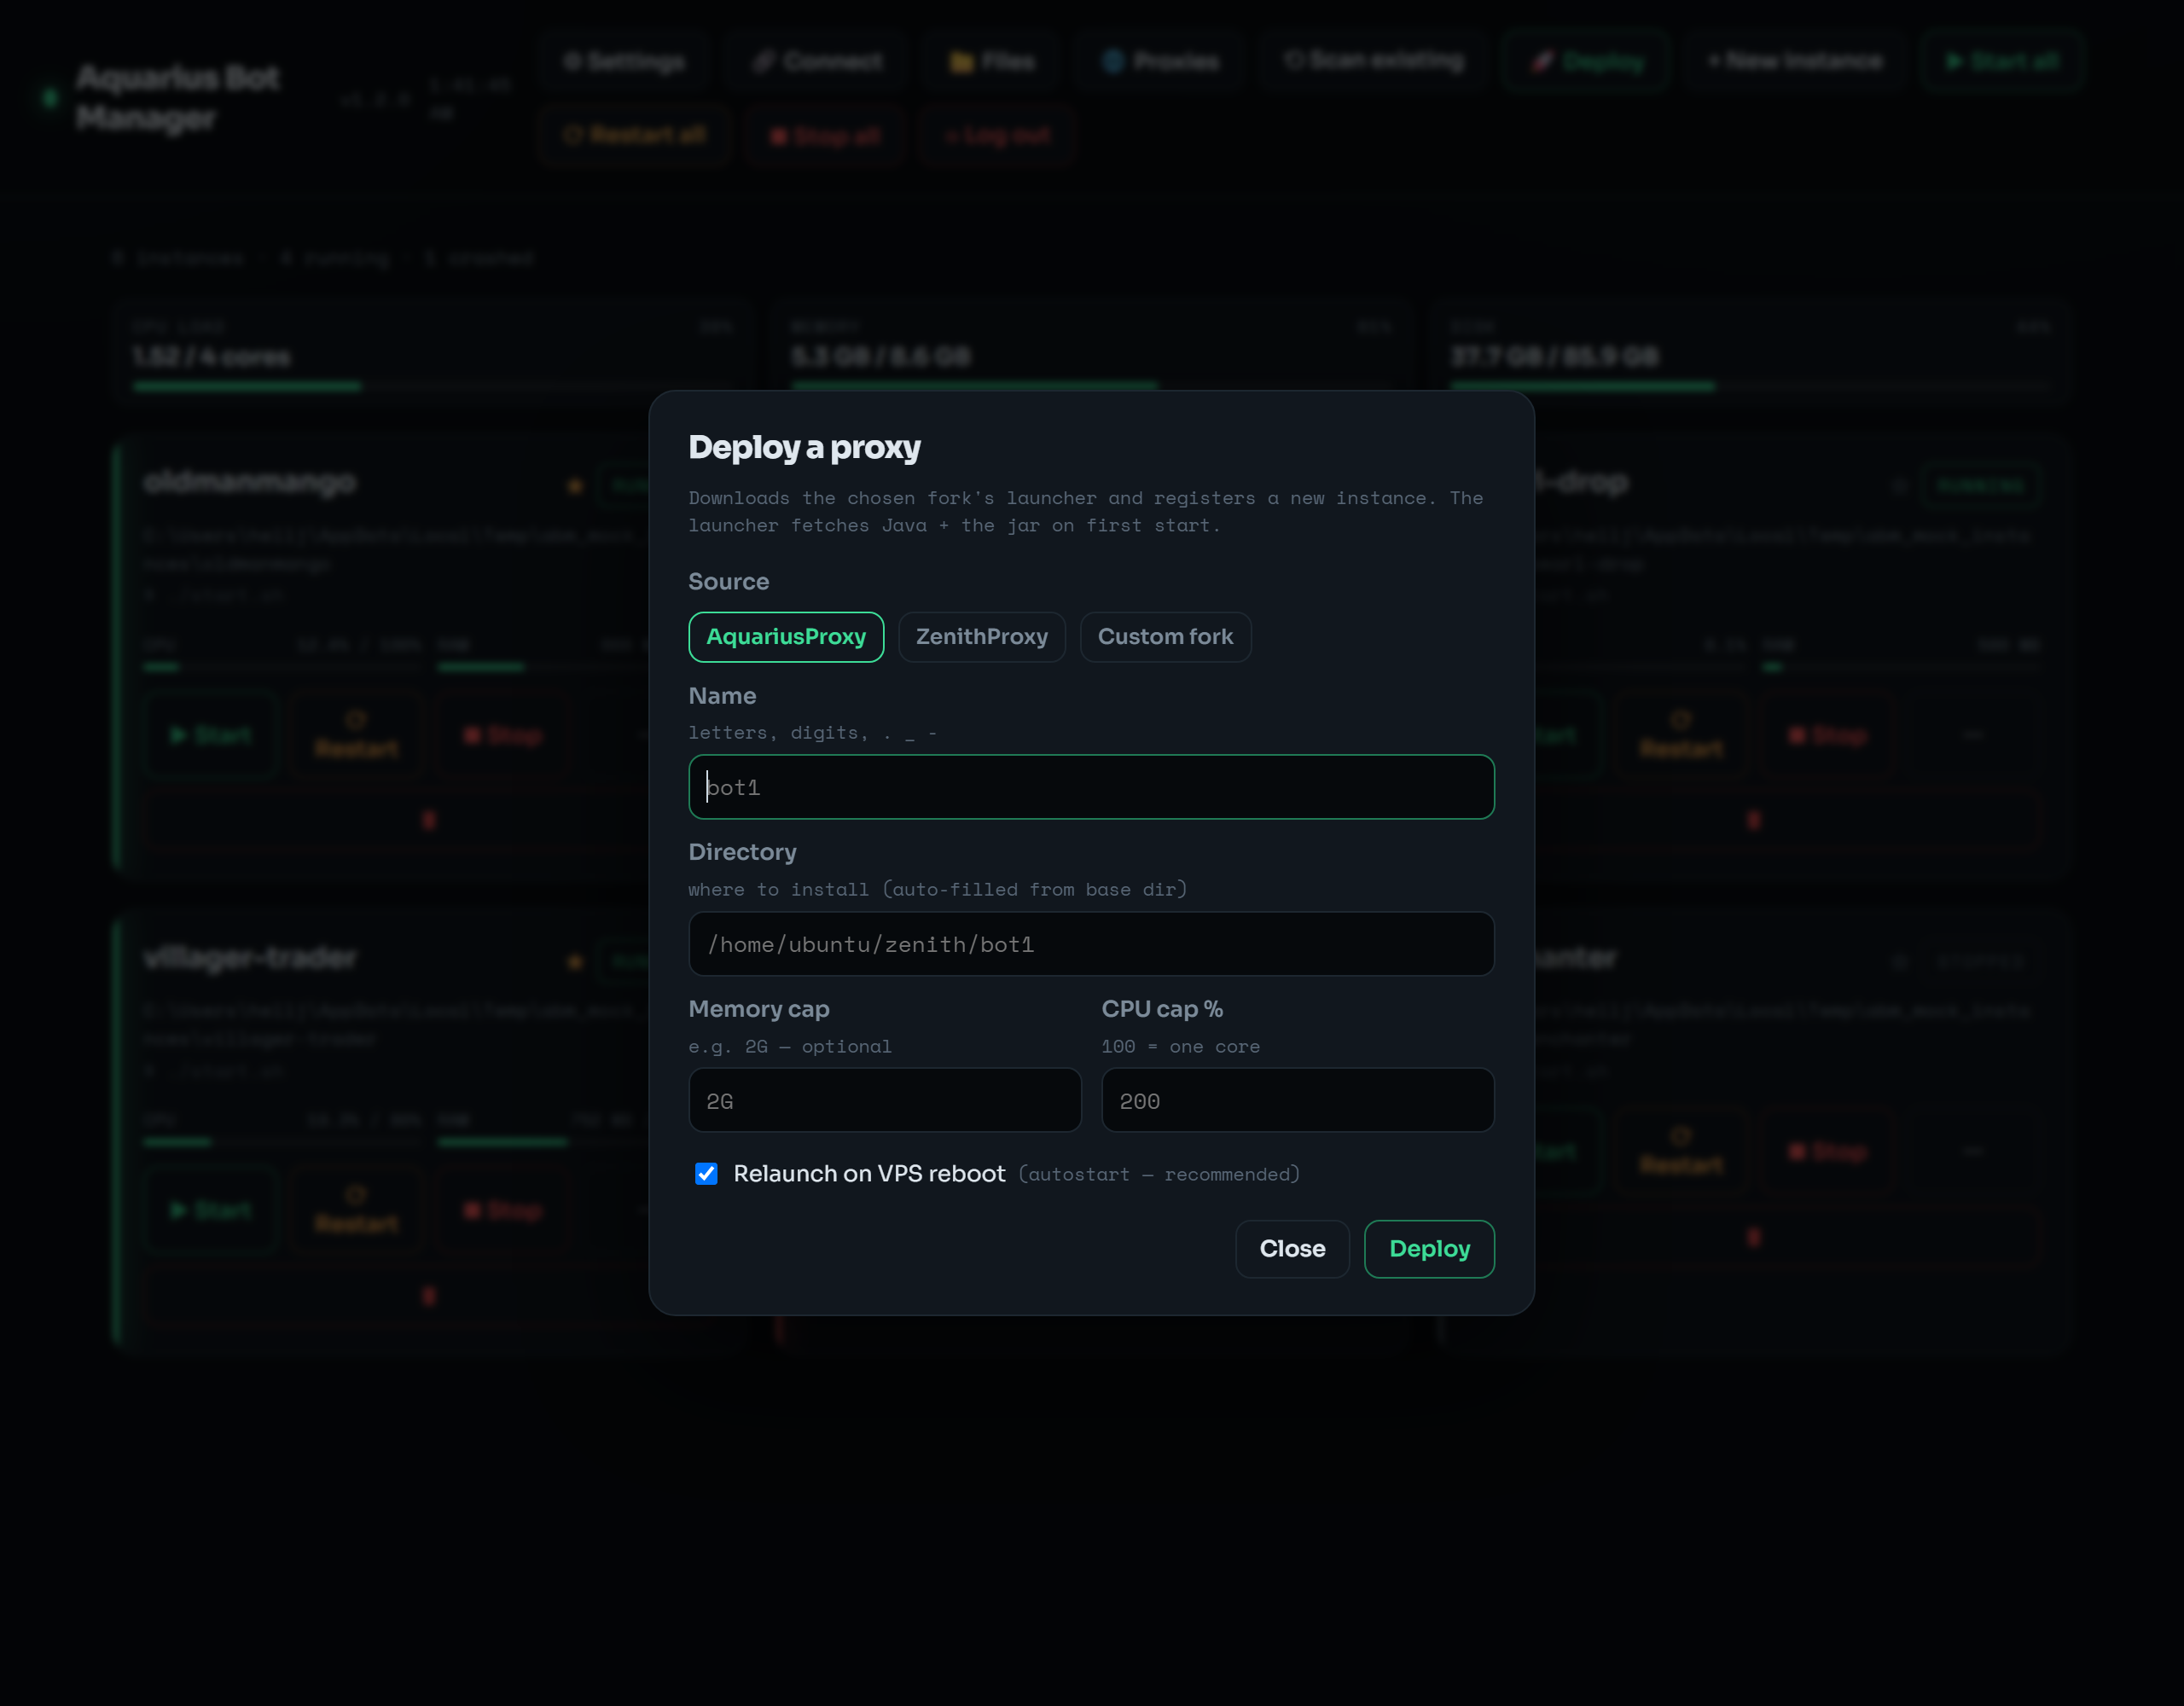 🚀 Deploy stands up a brand-new AquariusProxy / ZenithProxy / custom-fork bot — name it, set memory/CPU caps, and the launcher self-bootstraps Java and the jar.
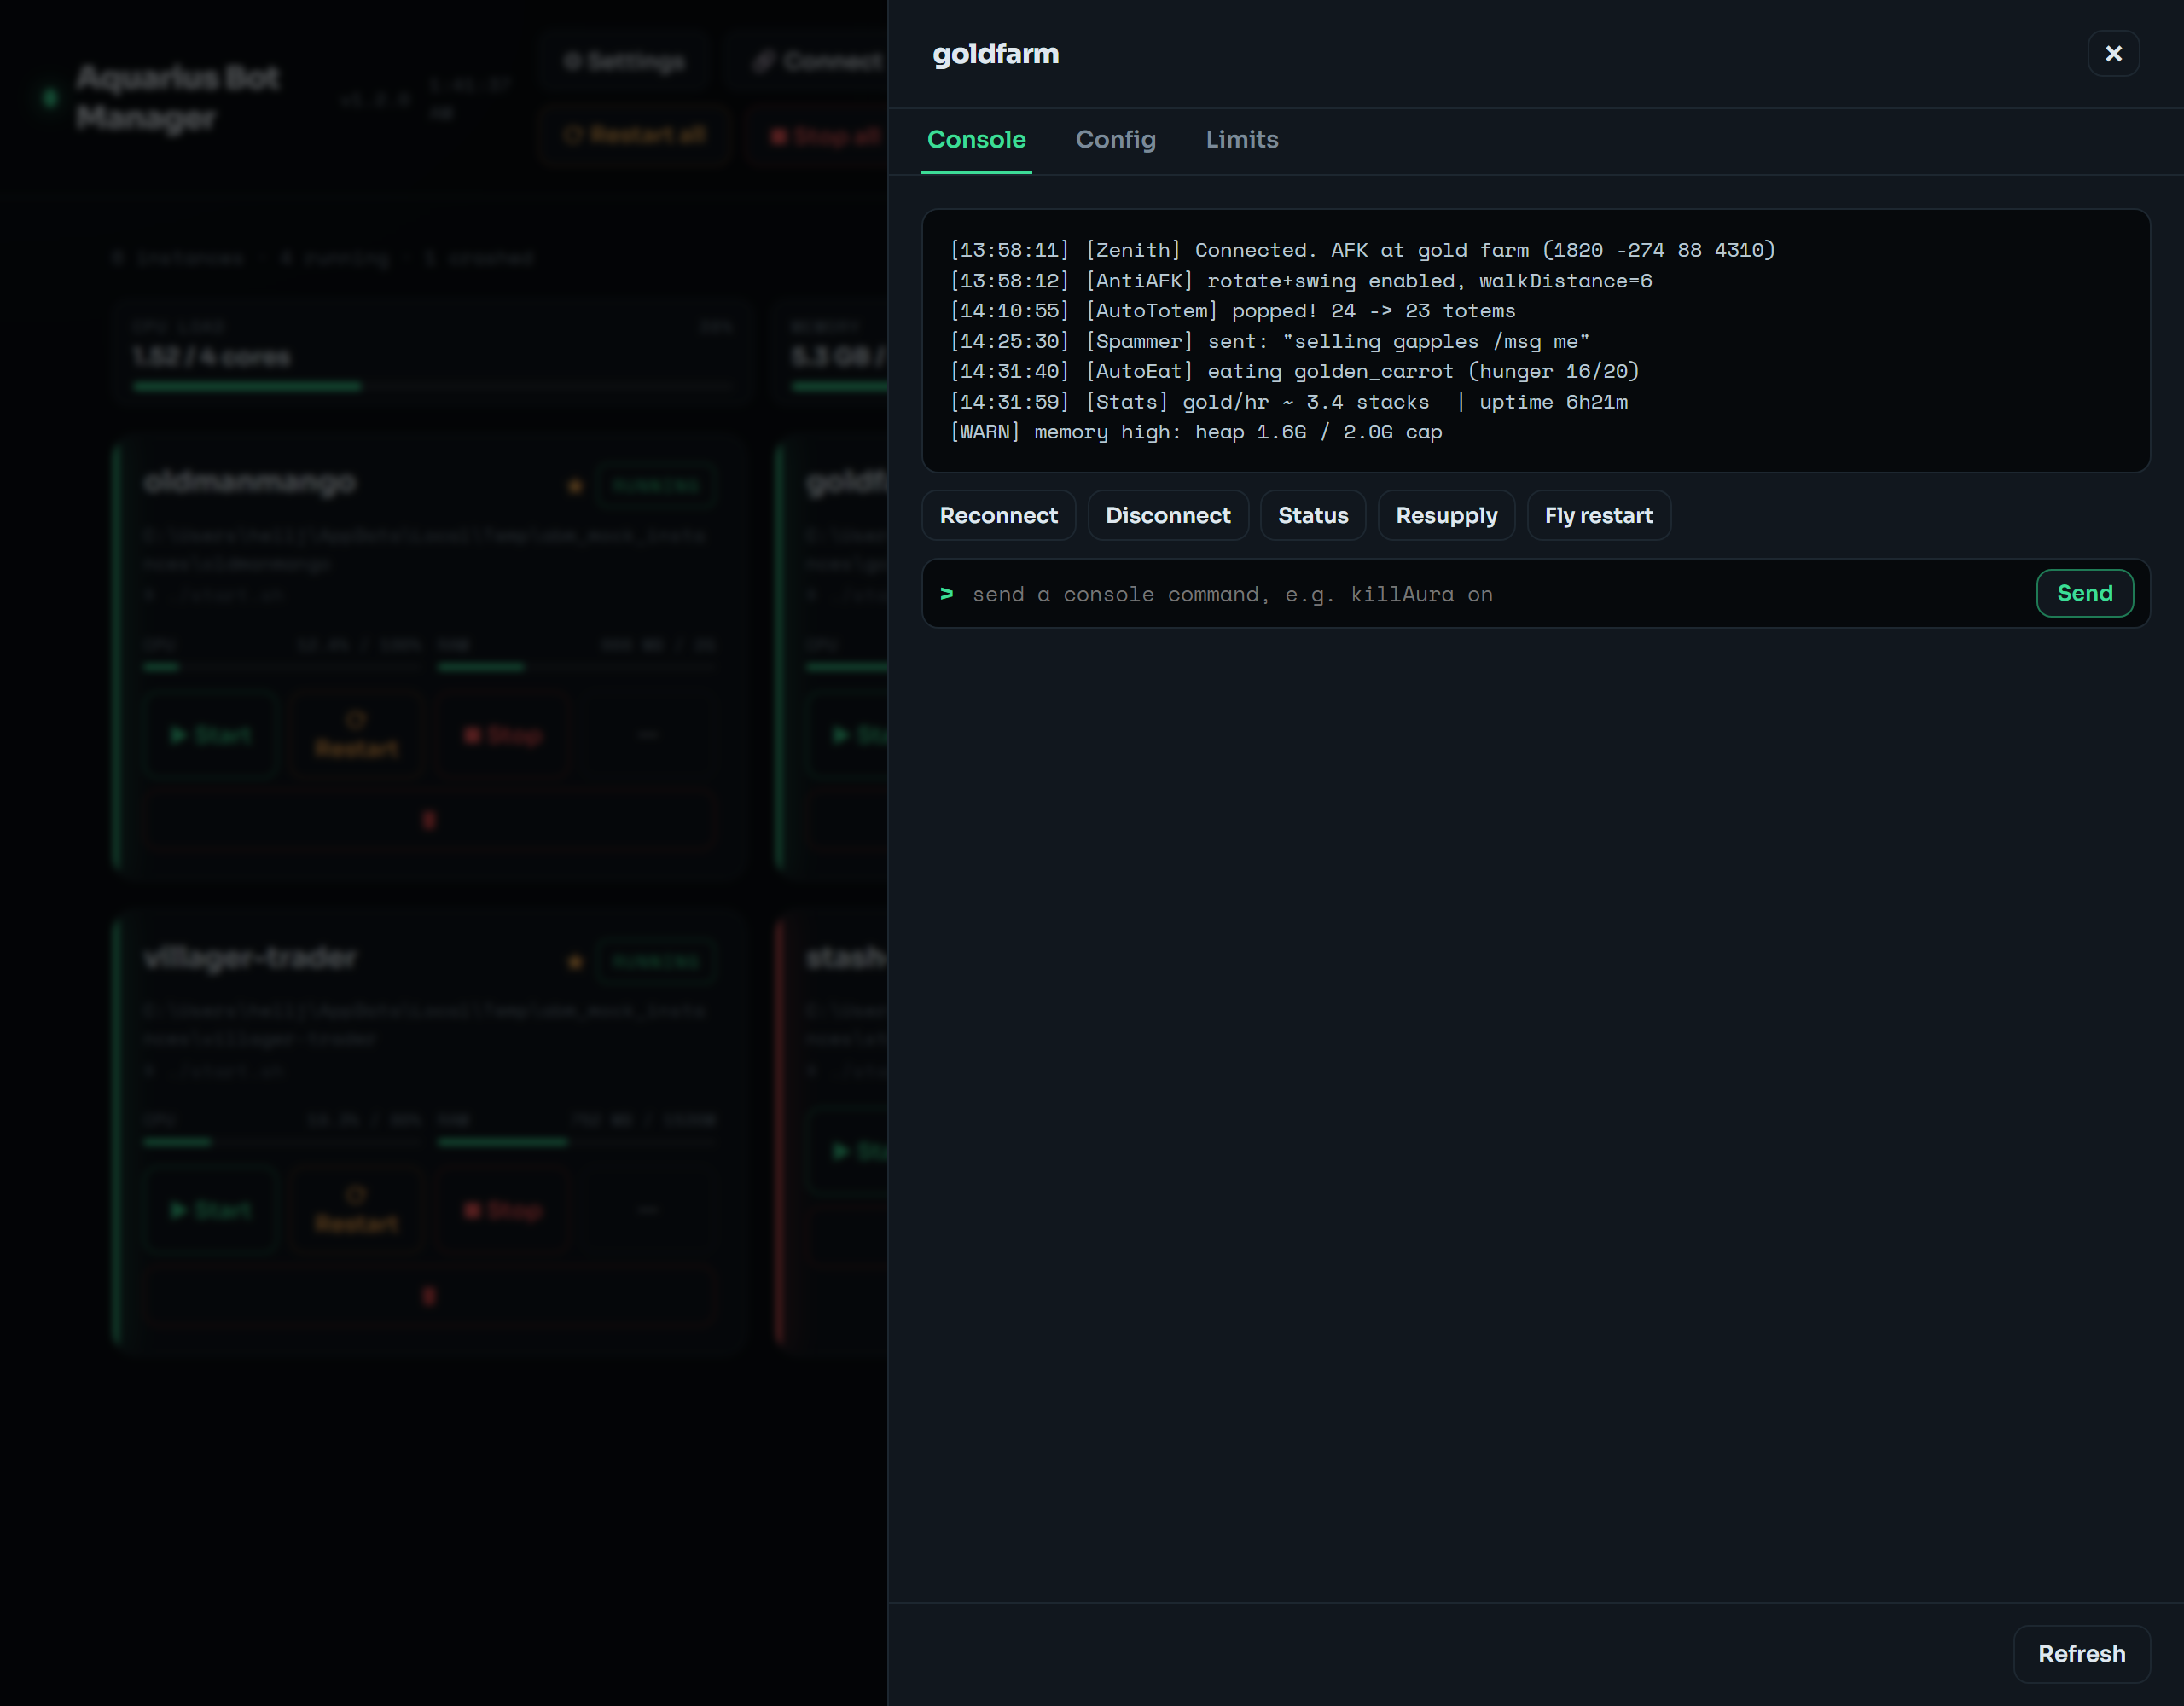
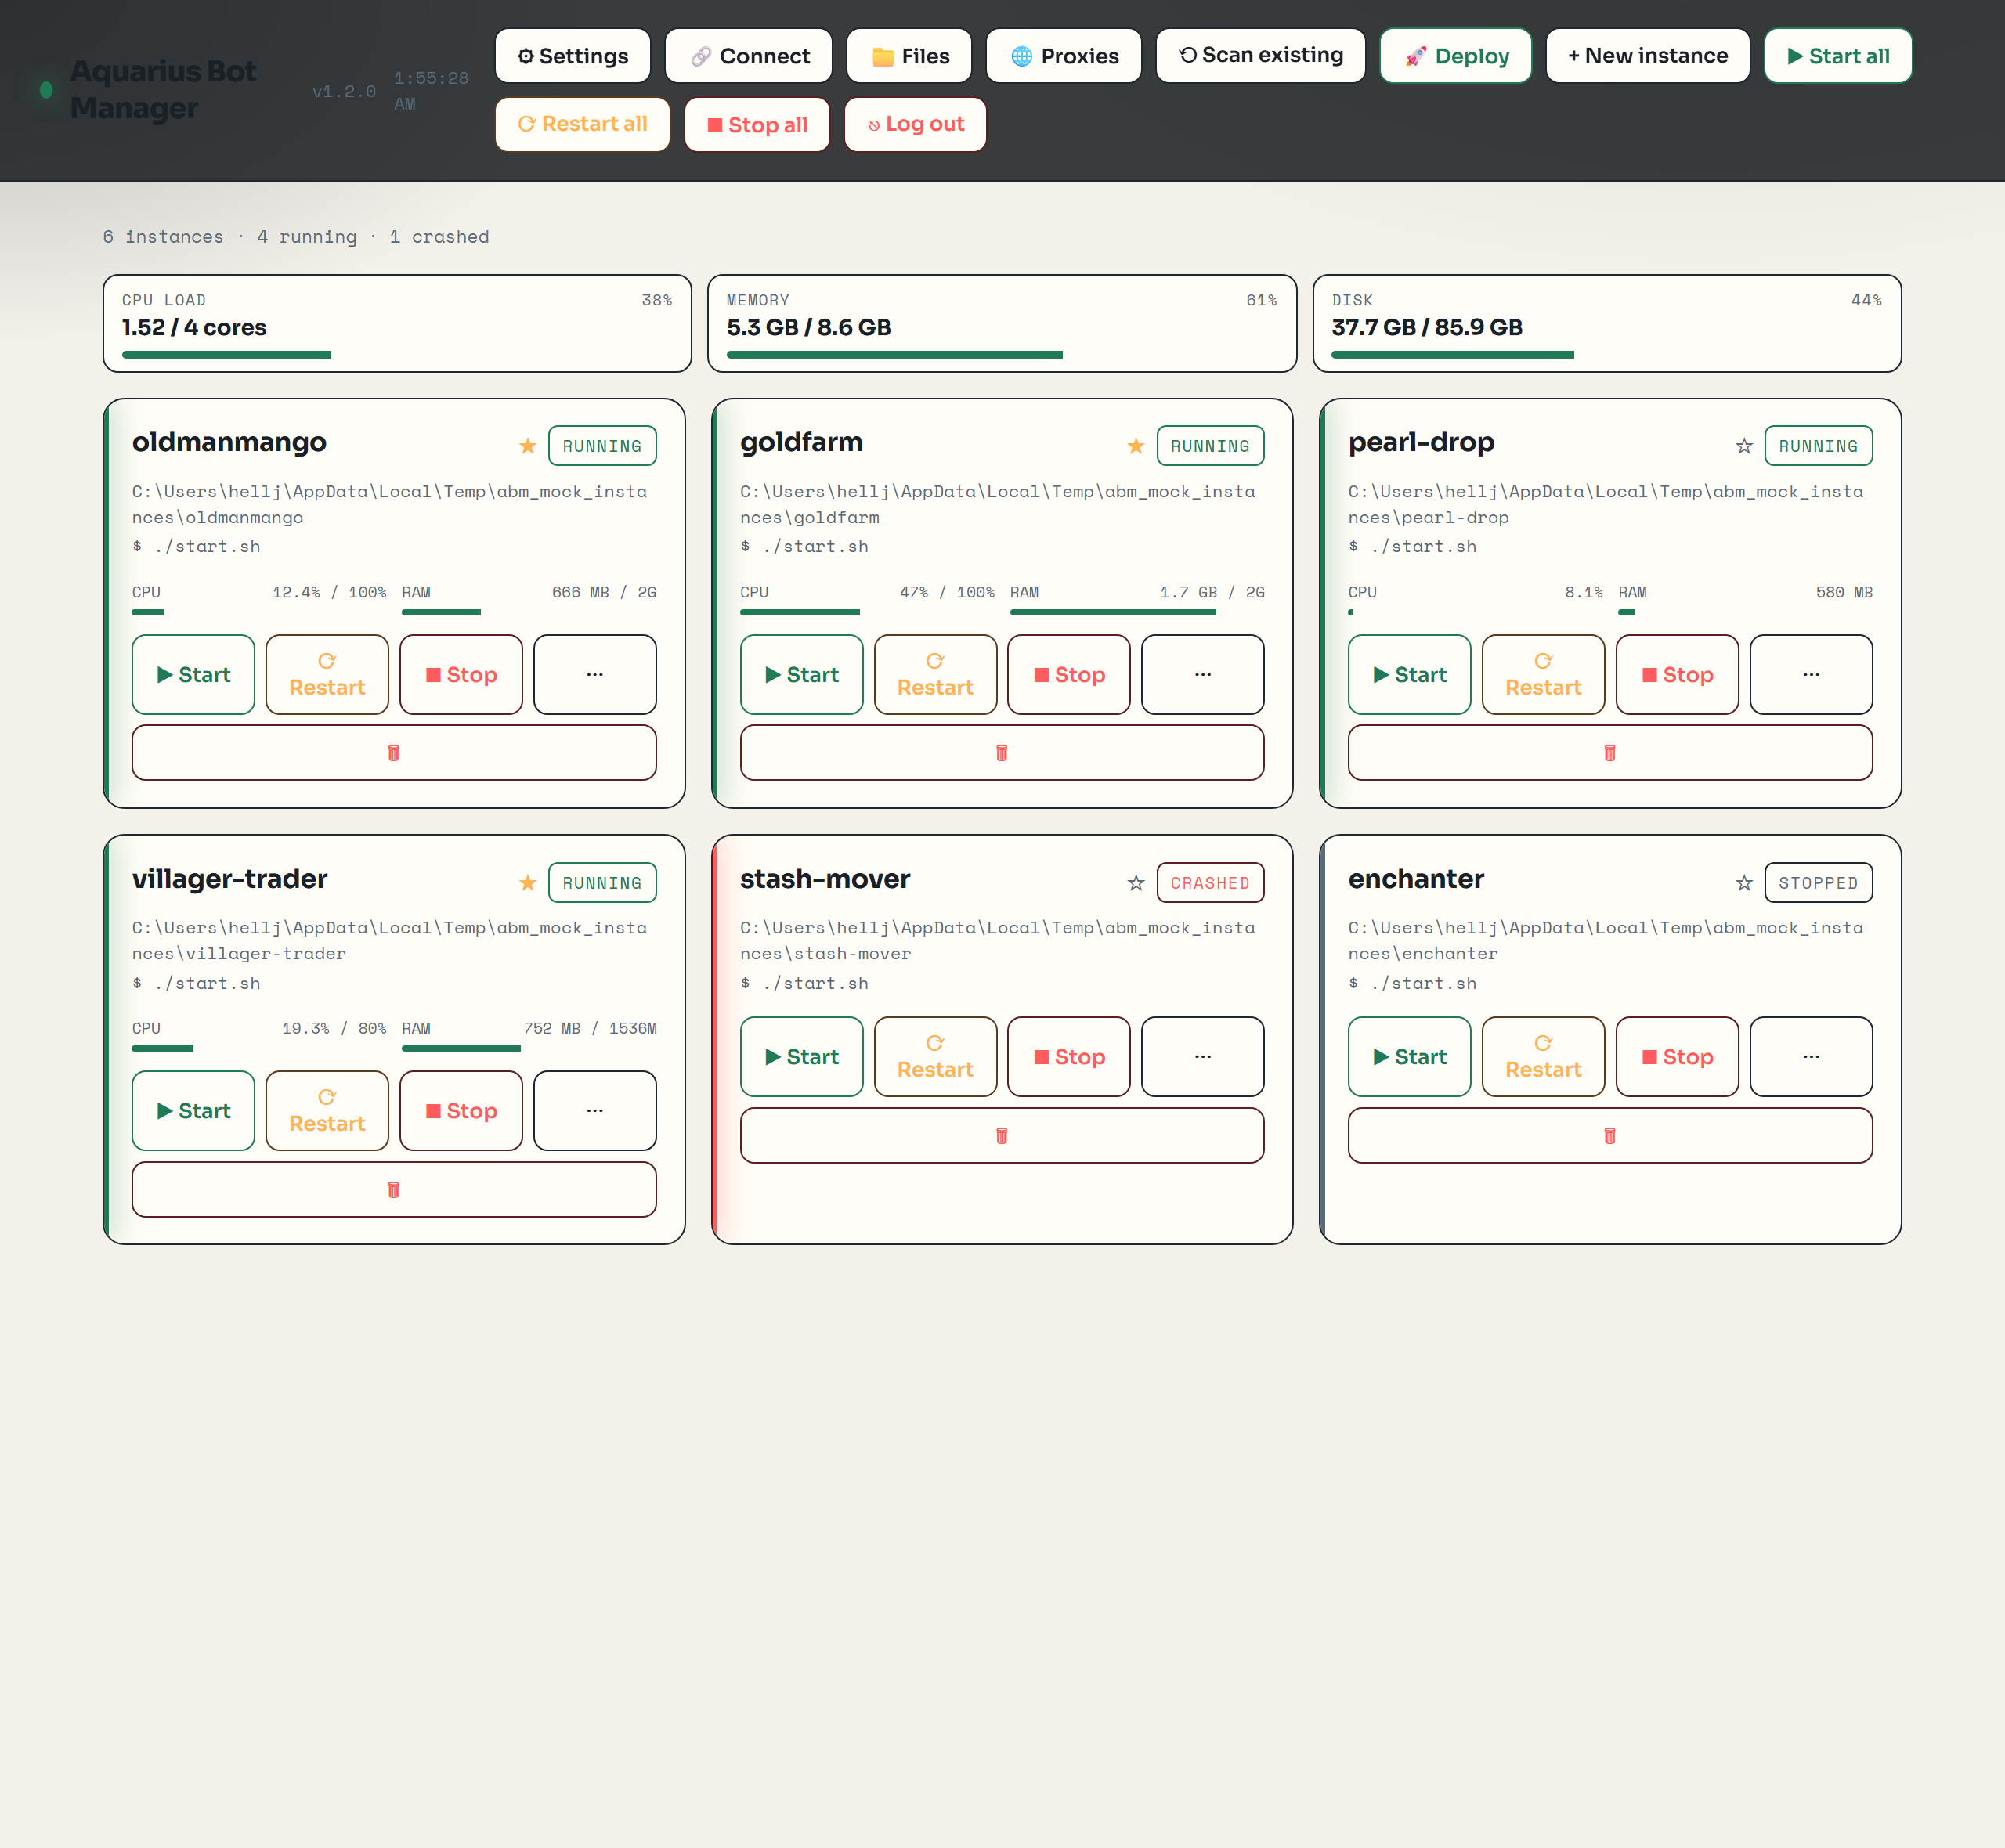
Each bot is a card: status (running / stopped / crashed), start/stop/restart, live CPU/RAM bars, a ★ autostart toggle, and a ⋯ drawer with Console, Config, and Limits tabs.
The drawer's Console tab shows a live tmux capture with a command bar (types into the bot's stdin) and editable quick-command preset buttons (configured in Settings → Console; defaults: Reconnect / Disconnect / Status).
The Config tab is a structured editor over the bot's config.json — toggles, numbers, lists, with a filter and a Raw JSON fallback. Save writes the file; Save & Restart applies it live.
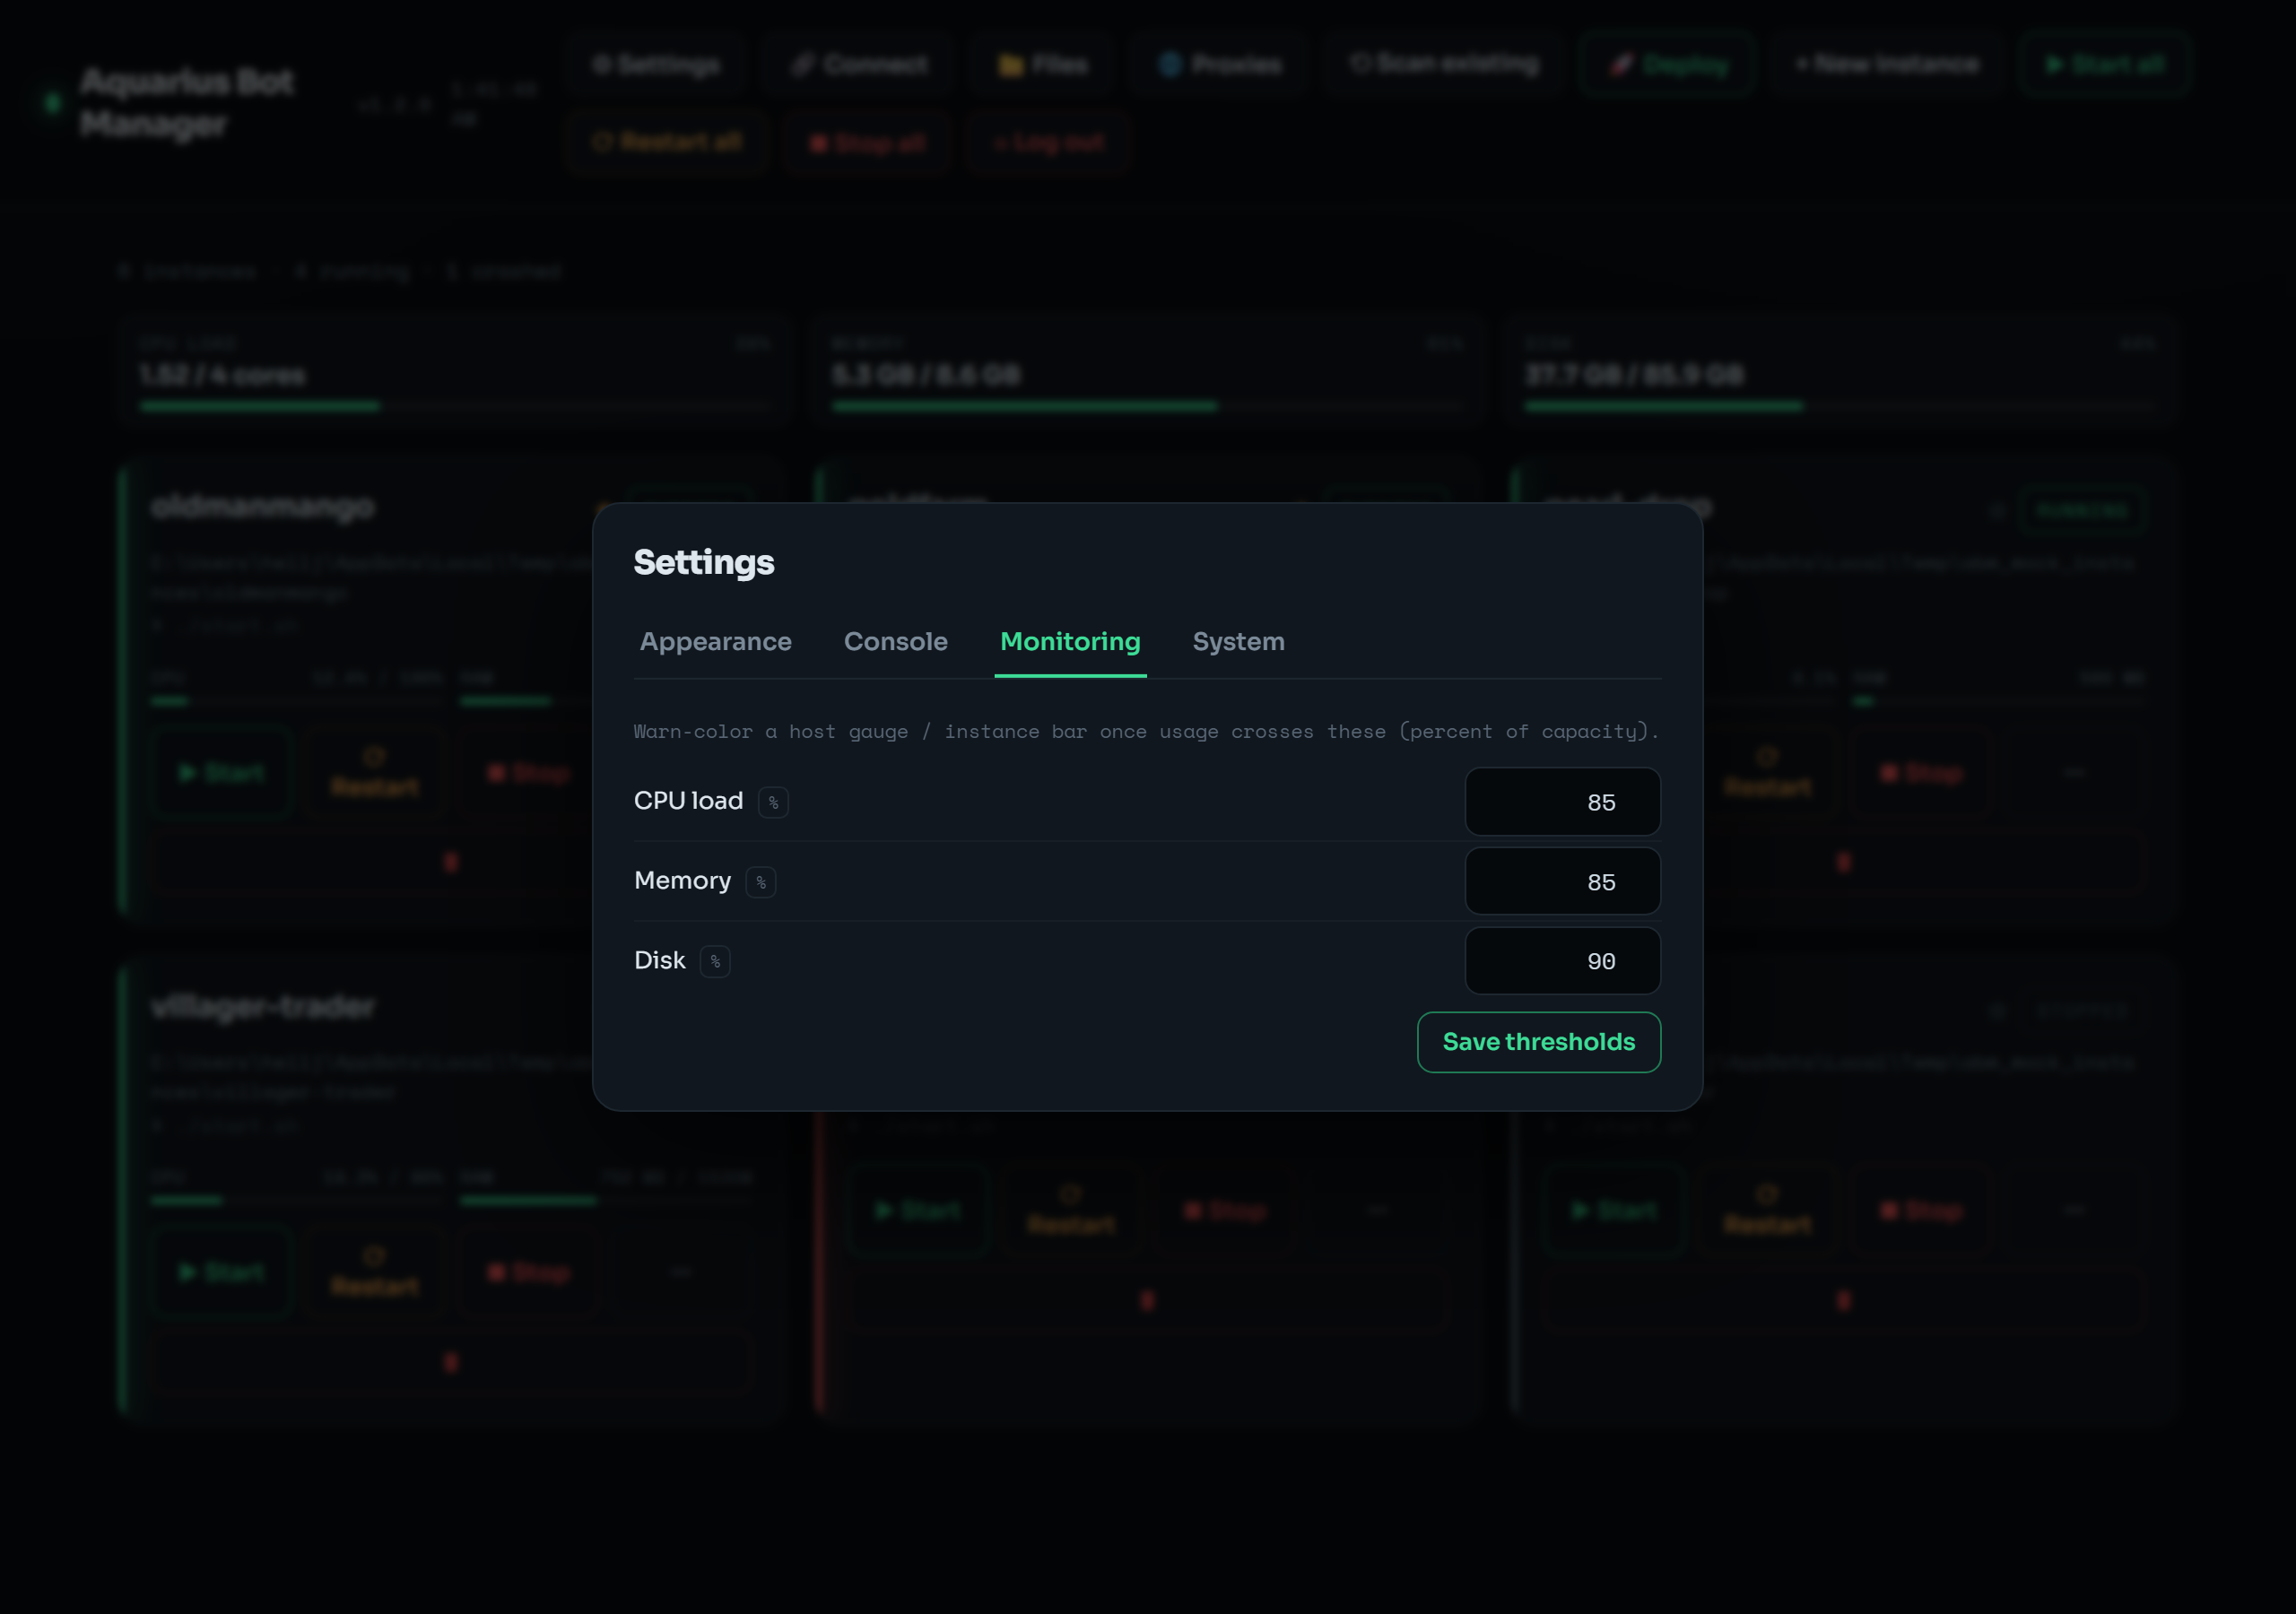
A sticky host gauge strip shows CPU load, memory, and disk vs capacity. Per-bot CPU%/RAM are read from each tmux pane's process tree. Bars turn warn/crit colored past the thresholds in Settings → Monitoring (defaults 85/85/90%).
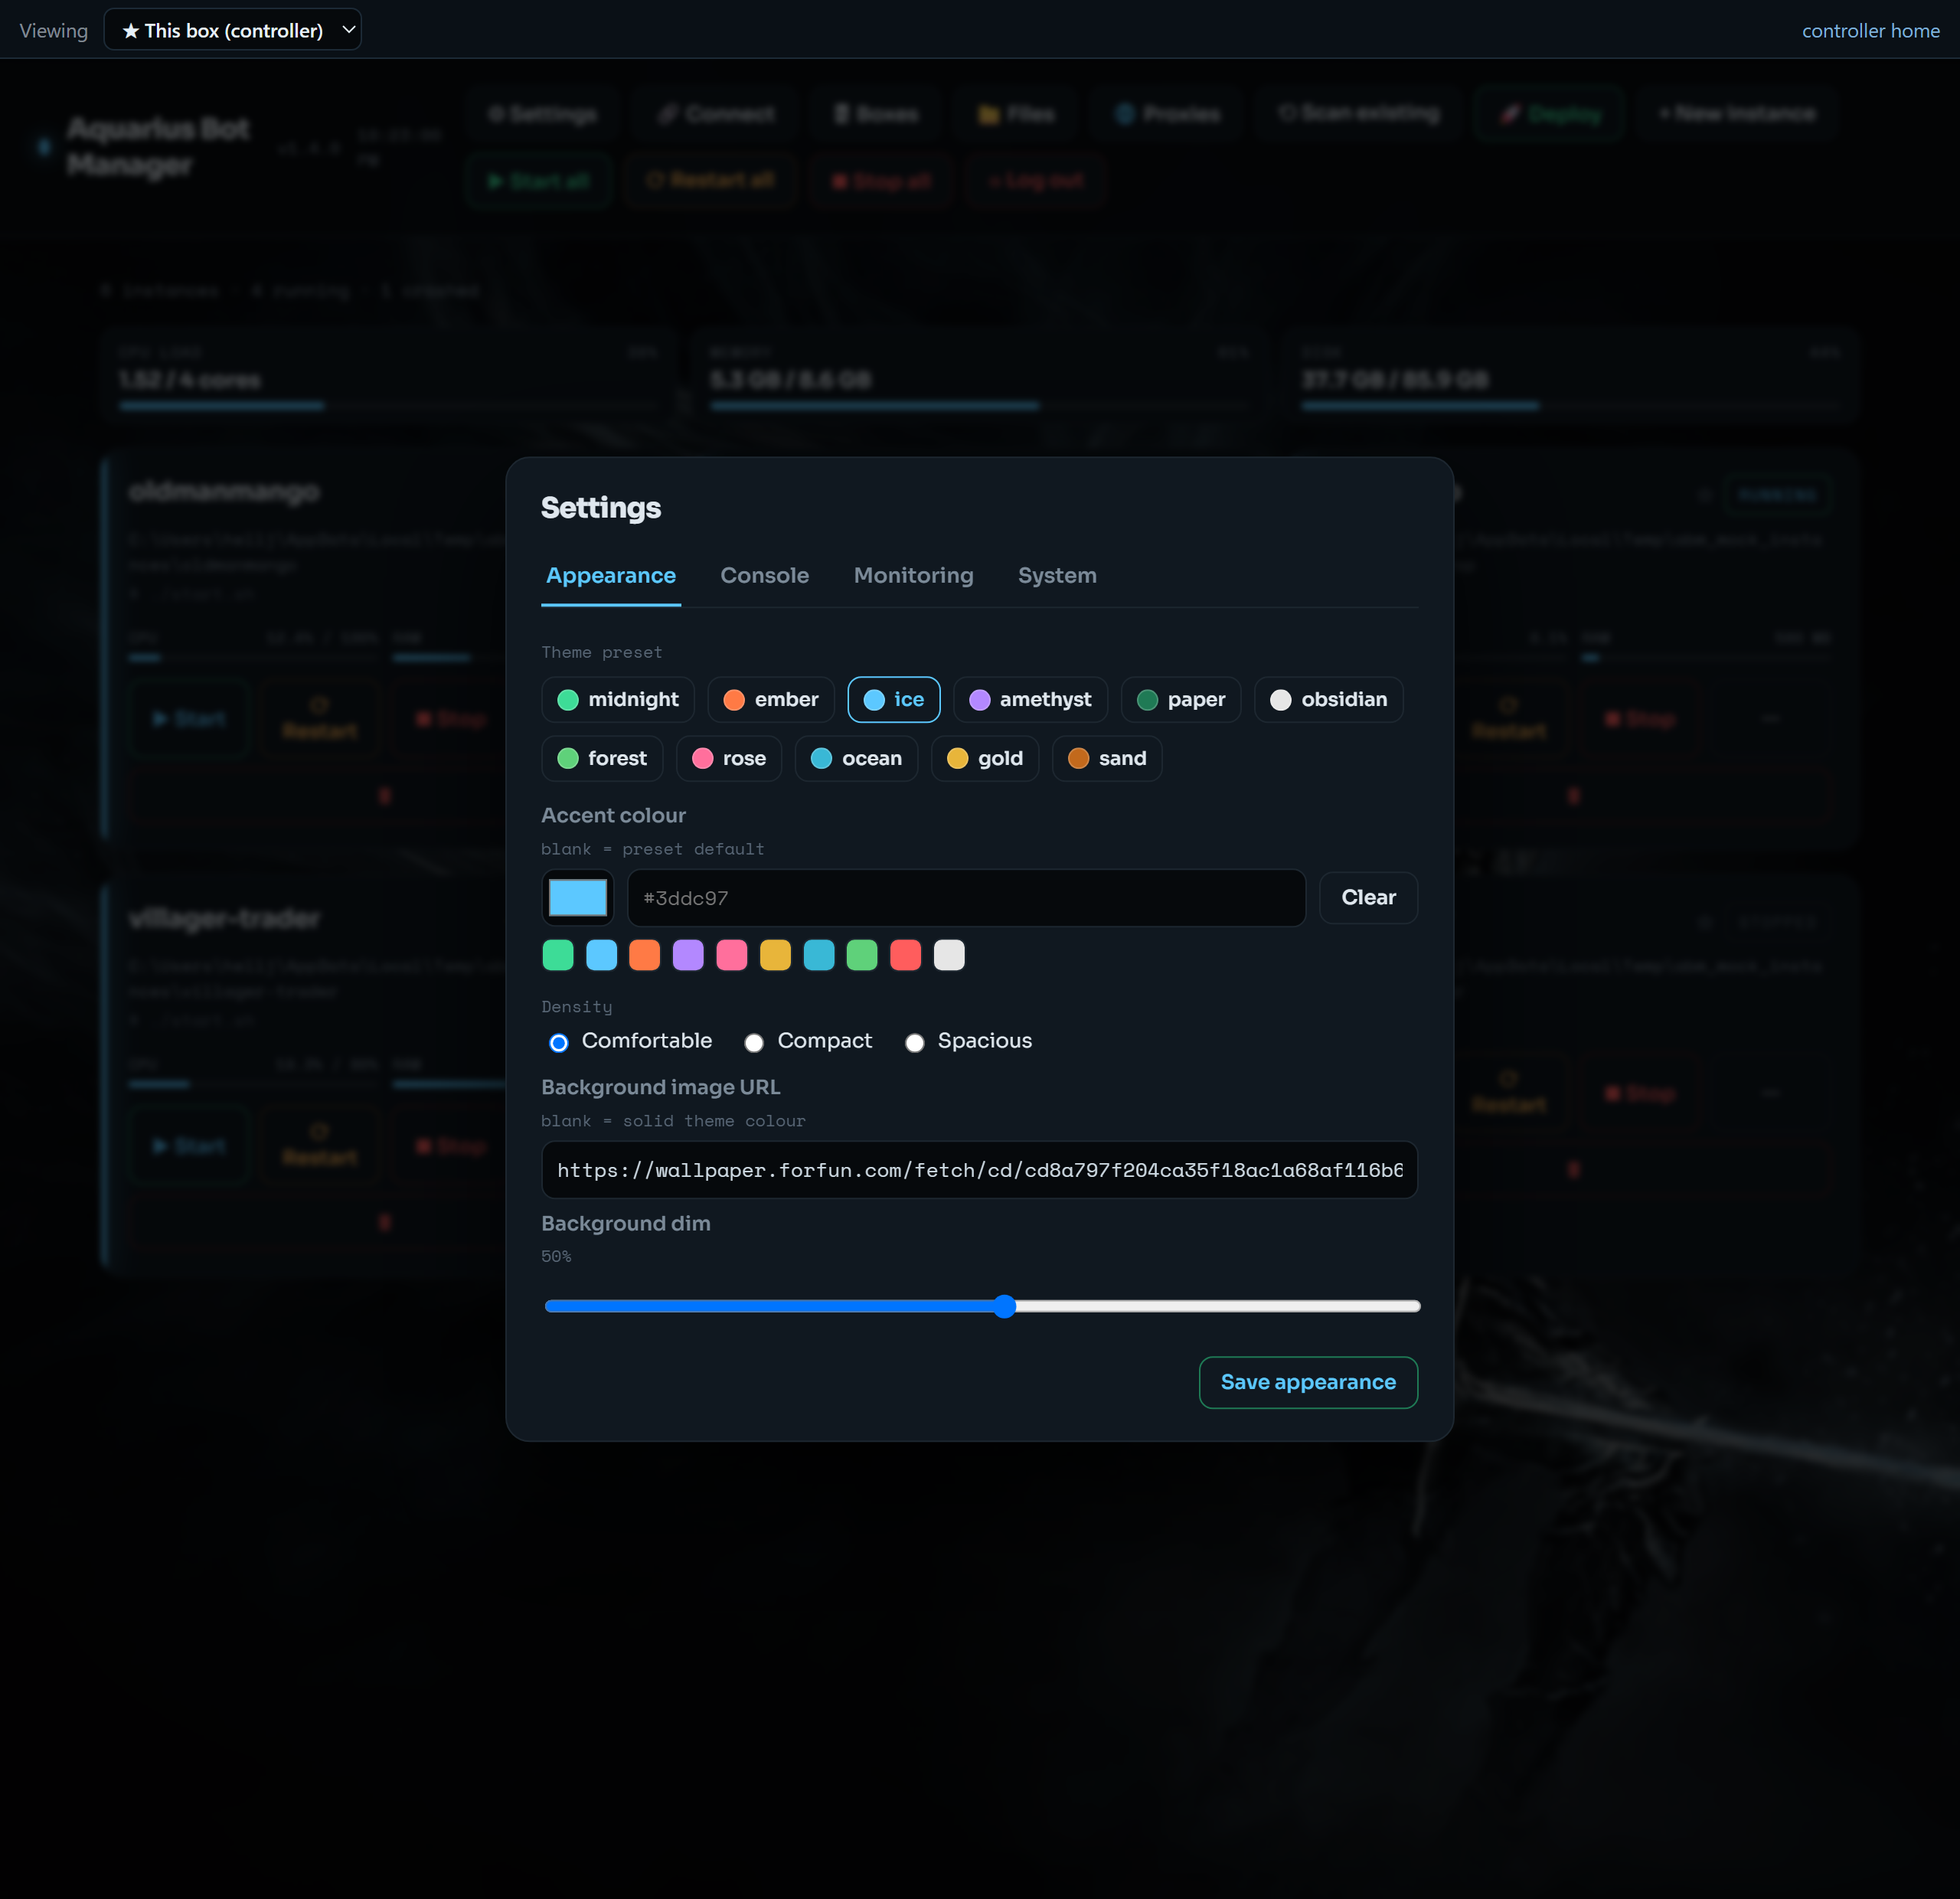
Settings → Appearance picks a theme preset — midnight, ember, ice, amethyst, and the light paper — plus an optional accent-color override.
The whole dashboard re-themes live; here it is in the light paper theme:
Your bots and the dashboard run on the VPS, independent of your browser. Closing the tab, restarting your PC, or dropping offline does not stop them.
- HTTPS mode — just reopen your bookmark; you're back (re-login only if the 7-day session expired).
-
Tunnel mode — the SSH tunnel is a process on your machine, so it ends when you restart. Re-open the tunnel, then the bookmark. To make that one double-click, open 🔗 Connect → download a reconnect shortcut (
.bat/.command/.sh); it opens the tunnel and the dashboard for you.
If the VPS itself reboots, the manager and your autostart bots come back automatically (see Configuration).
Everything in the UI is also a command. abm is a thin wrapper around manager.py.
abm list                       # registered instances
abm status                     # per-instance running/stopped/crashed
abm start   bot1               # or: all
abm stop    bot1
abm restart all
abm logs    bot1 --lines 200
abm send bot1 "connect" # send a command to the live consoleabm add bot1 /home/ubuntu/zenith/bot1 [--launch-cmd ...] [--stop-keys "stop,Enter"] [--autostart]
abm delete bot1 [--force] # --force stops it first; only edits instances.json
abm discover /home/ubuntu/zenith # find bot dirs under a base folder
abm scan # list unmanaged tmux sessions, proxies flagged
abm adopt <session> [--name NAME] # bind an existing tmux session as a managed instance
abm autostart bot1 --on # or --off; relaunch on host boot
abm boot # start all autostart instances (run at host boot)Proxies (see Proxies)
abm proxies                                # list each instance's proxy
abm proxy   bot1 --host 1.2.3.4 --port 1080
abm proxybulk --list "h:p,h:p" [--targets a,b|all|errored] [--mode roundrobin|same|random] [--restart]
abm proxyhealth [--targets all] [--lines 200]   # list bots whose console shows proxy errors
abm webshare count  --token <KEY>
abm webshare import --token <KEY> [--auth userpass|ip] [--targets all|errored] [--mode roundrobin|same|random] [--countries US,CA] [--save-token] [--restart]abm deploy bot1 --source aquarius # or zenith, or custom --repo owner/repo; [--memory 2G] [--cpu 200] [--no-autostart]
abm limits bot1 --memory 2G --cpu 200 # caps (--clear to remove; no flags to view)
abm files [path] # list files under the allowed roots (jailed)abm sysinfo
abm settings [--theme ember] [--accent "#ff7a45"] [--enable-system | --disable-system]
abm update # apt update && upgrade (system actions must be enabled)
abm reboot # reboot the host (system actions must be enabled)
abm setpassword # set/replace the web UI login
abm logout-all # invalidate active web sessions
# update the manager itself (no reinstall):
abm selfupdate [--no-restart] # git pull + restart the web UI
abm autoupdate on [--schedule daily] # install a systemd timer that self-updates on a schedule
abm autoupdate off | status
abm serve --host 127.0.0.1 --port 8765 # run the web server (the systemd unit does this for you)