Repository navigation
Performance Load Test
Question: how many pods does a 500-person company need if everyone works in ServiceOps all day?
Answer (v1.113.38):
| Usage | Web pods (1 CPU, 2 workers × 4 threads each) | PostgreSQL | Fits this cluster? |
|---|---|---|---|
| Normal pace — all 500 signed in all day, one page action every 30–60 s | 4 (5 for p95 under 1 s) | 2 CPU | Only by spreading pods over both nodes |
| Busy — one page action every 10–20 s, all day | about 7–8 | 2–3 CPU | No: needs about 10–11 cores, more than both nodes together |
| Today's production (1 pod, PostgreSQL 1 CPU) | — | — | About 100–150 users at normal pace (estimated from the runs, not measured) |
Memory: about 600–800 MiB per web pod under load (raise the limit to 1.5 GiB), 450 MiB for PostgreSQL. One background worker is enough (0.02 CPU).
Every run used 500 users. The tests ran on an isolated copy (namespace perftest on homeserver-02, its own PostgreSQL), never on production. The copy ran the production image, Gunicorn settings and resource limits, and held a year of data: 500 agents in six teams, 20,000 tickets and 40,000 comments. k6 replayed what browsers send: sign-in with CSRF, page HTML, first-visit static files, the 25-second notification poll, new incidents and work notes. Users signed in over 5 minutes (one run: 1 minute). Steady state is the 4.5 minutes after everyone signed in. CPU was sampled from each pod's cgroup every 10 s.
| Run | Version | Web pods | Pace | Steady-state result |
|---|---|---|---|---|
| 1 | 1.113.36 | 1 | busy | Collapsed: 95% failed, 46 of 500 signed in |
| 2 | 1.113.36 | 3 | busy | Collapsed: 68% failed, 11 req/s at 100% CPU |
| 3 | 1.113.37 (dashboard fix) | 3 | busy | 9% failed, median 17 s |
| 5 | 1.113.37 | 3 | normal | 6% failed, median 14 s |
| 6 | 1.113.37 | 5 | normal | 0.02% failed, median 4.9 s, node 80% busy |
| 9 | C driver | 3 | normal | median 78 ms, p95 1.8 s, p99 9.1 s, 0% failed |
| 10 | C driver | 4 | normal | median 94 ms, p95 1.3 s, p99 2.9 s, 0.02% failed |
| 11 | 1.113.38 | 5 | busy | median 5.8 s: node 88% busy, PostgreSQL 1.6 of 2 CPU |
| 12 | 1.113.38 | 4 | normal, all sign in within 1 min | all 500 signed in; sign-in median 15 s during the rush, queue cleared in a few minutes |
Raw numbers: summary.json. Scripts: flows.js (k6), seed.py, perftest-values.yaml, analyze.py. The test password comes from LOADTEST_PASSWORD.
- Dashboard counted every ticket in Python (1.113.37). At 20,000 tickets an agent's dashboard took 915 ms; one grouped query takes 77 ms and returns identical counts.
- PostgreSQL driver ran in pure Python (1.113.38). The image removed psycopg's binary wheel (its bundled libraries fail the vulnerability gate), leaving the slow fallback. psycopg's C module is now compiled against Debian's libpq in a build stage. Average CPU per page fell from 122 ms to 53 ms. With the same 500 users and 3 pods, the median went from 14 s to 117 ms.
- Per page action: about 0.13 s of web CPU and 0.06 s of PostgreSQL CPU under load (1.113.38). The dashboard, task board and search are the heaviest pages.
- Notification poll: every open browser polls every 25 s. 500 users make 20 polls/s, about two thirds of all requests, whatever their working pace.
- Hardware: homeserver-02 is a laptop i7-8650U (4 cores, 8 threads); homeserver-01 is an Intel N97 (4 low-power cores). Under sustained load both run well below their single-core turbo speed, so a request costs about twice its idle time. At 5 pods the test node itself was the limit.
- Database connections: each web process uses up to 4 connections (one per thread), so 4 pods need about 32 plus the worker, well inside PostgreSQL's default 100.
| Change | Expected effect |
|---|---|
| Poll every 60 s instead of 25 s | Superseded (B-439): one tab per browser checks, unchanged checks are bodiless 304s, and with the live stream the check runs every 2 minutes |
| Request-scoped caching of permission and settings lookups (in progress) | Fewer of the 30–40 queries per page; lowers PostgreSQL CPU |
Trigram index for search (needs the pg_trgm extension) |
Done (B-442): most columns already had indexes; comments and ticket numbers did not, and an OR with a comment subquery forced full scans. Ticket search query 86–310 ms → 1–2 ms on 20,000 tickets and 40,000 comments |
Static files from the offload sidecar (web.staticOffload) |
Done: enabled in production since Helm revision 187 |
The 2026-10-11 review remediation implements web scaling, protected static offload and load-tolerant probes. The final isolated run reached 1,000 users and held for ten minutes, but failed the performance target (63.07% page failures, p95 60.01 s); both replicas stayed ready with zero restarts. Production was not upgraded. The measurements below describe the earlier single-replica deployment.
Run: 2026-10-10 18:59–19:01 JST against production (operations namespace, MicroK8s) running v1.113.24, Helm revision 173, image ghcr.io/awijesundara/serviceops-server@sha256:d51d83a2d6f5….
Result in one line: with the current production footprint (one web pod, 1 CPU, 8 request slots) ServiceOps saturated at about 450 concurrent users during sign-in, well short of the 1,000-user target. The test was stopped after 1.6 minutes because production stopped serving requests.
| Target | 1,000 concurrent users, 3-minute ramp, 6-minute hold |
| Reached | 452 concurrent users at 1.6 minutes, then stopped to restore service |
| Requests | 814 HTTP requests, 31% failed (refused connections once the web pod went unready) |
| Throughput peak | 14 requests/s |
| Response time (successful requests) | median 17.6 s, p95 38.1 s |
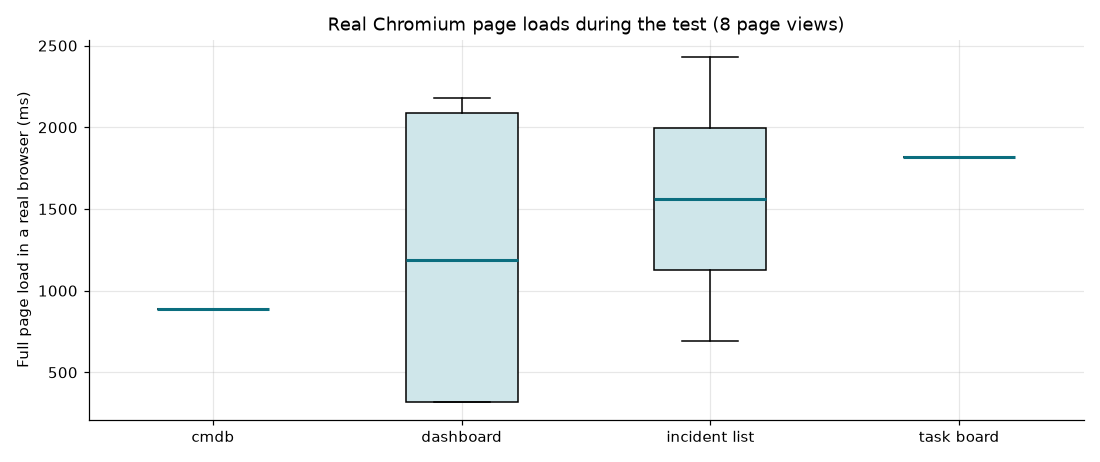
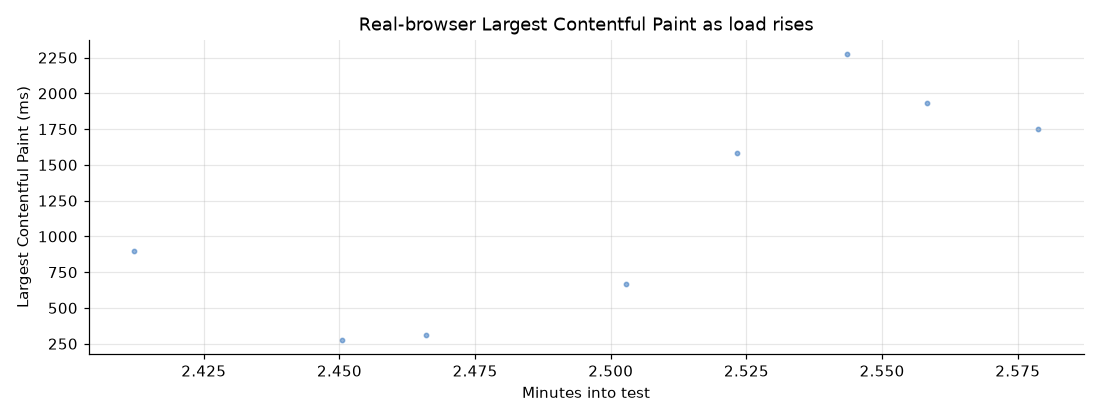
| Real Chromium page loads | 8 page views, median full load 1.35 s, median Largest Contentful Paint 1.24 s (taken in the first minute, before saturation) |
| Web pod | CPU pinned at its 1,000 m limit from minute 0.5; memory peaked at 530 MiB of 1 GiB |
| PostgreSQL | peak 130 m CPU, 179 MiB: not the bottleneck |
| Production impact | readiness failed from about 19:00:10, so the single web pod left the Service; liveness restarted it once at 19:01:38; ready again 19:01:49. Real users could not reach ServiceOps for roughly 1.5–2 minutes. |
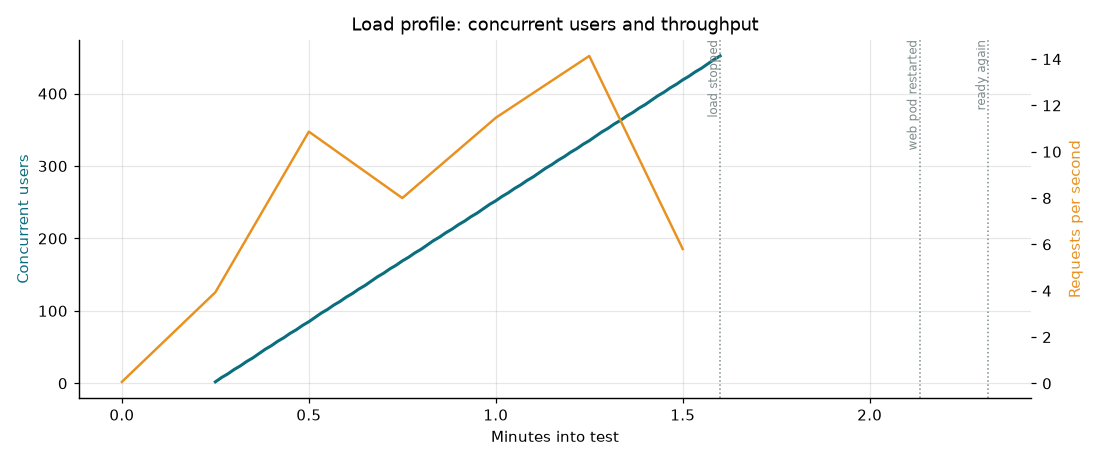
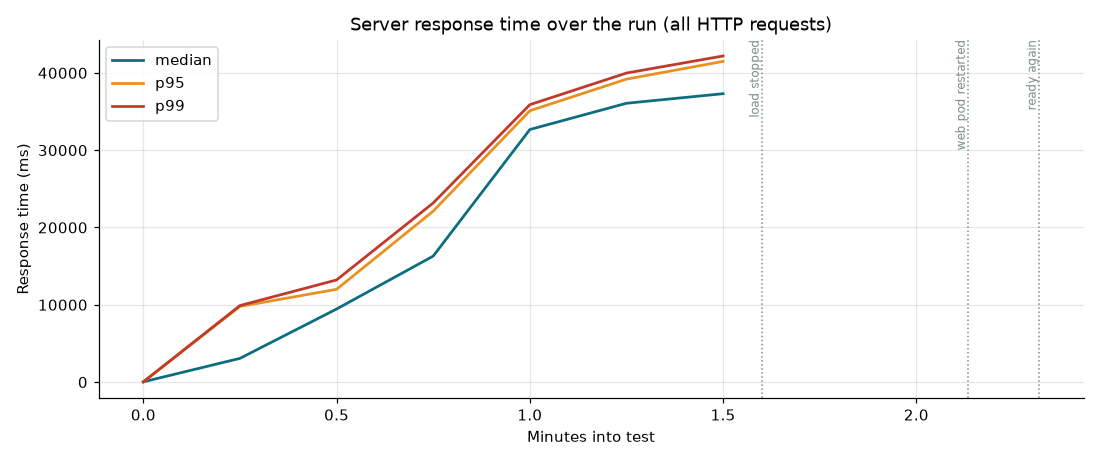
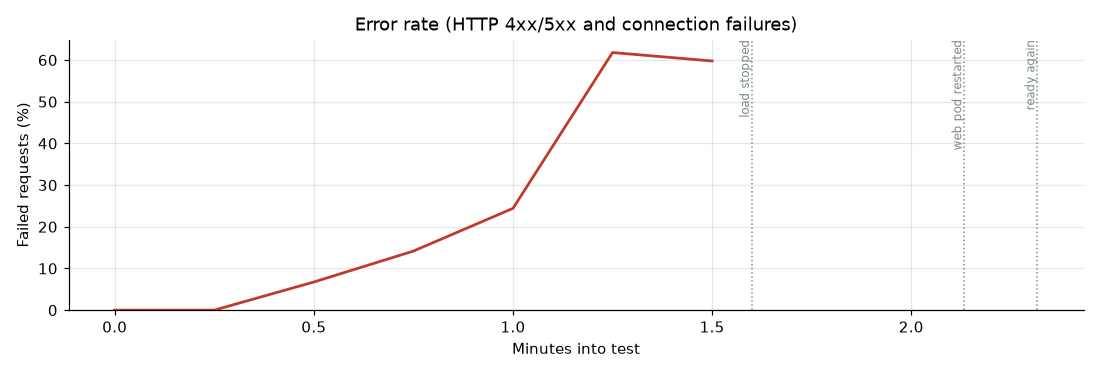
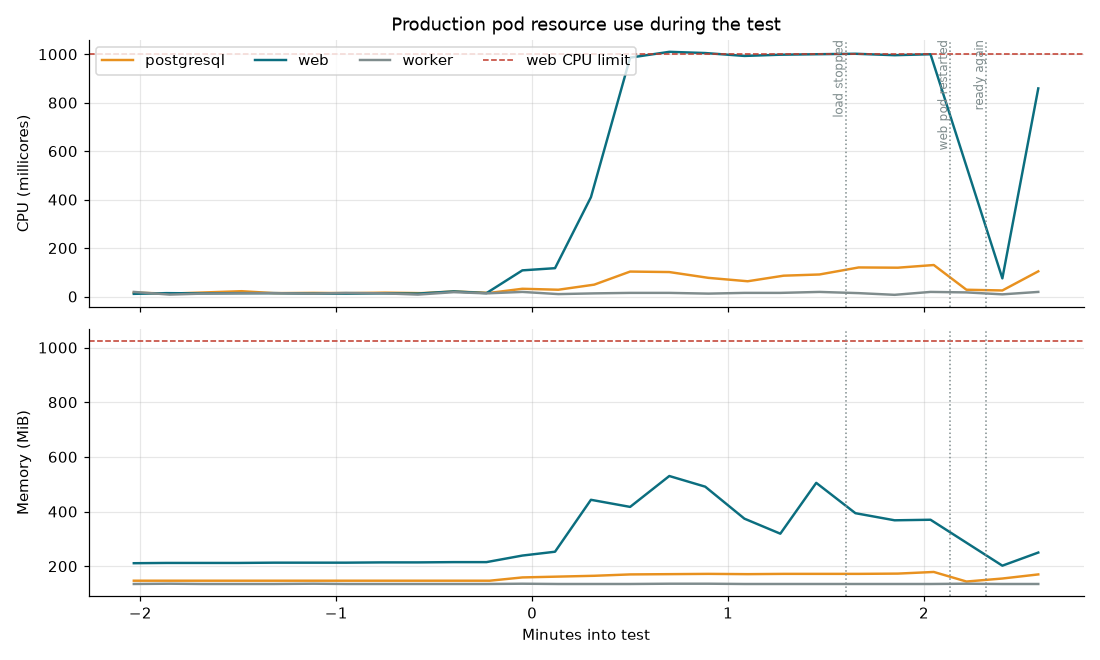
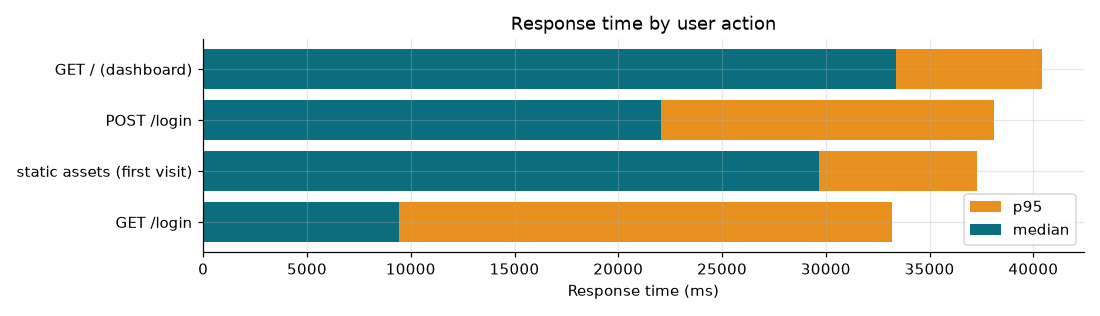
Every recorded request belongs to the sign-in phase (login page, login submit, first dashboard, first-visit static files). Users never reached steady browsing, so this run says nothing yet about steady-state page times under load.
| Action | Requests | Median | p95 |
|---|---|---|---|
| Static files on first visit (CSS, JS, images) | 248 | 29.7 s | 37.3 s |
GET /login |
139 | 9.5 s | 33.2 s |
POST /login |
114 | 22.0 s | 38.1 s |
GET / dashboard after sign-in |
60 | 33.4 s | 40.4 s |
-
Eight request slots on one CPU. Gunicorn runs 2 workers × 4 threads (
gthread). Every request, including health checks and static files, competes for those slots. - Sign-in is deliberately expensive. Each login verifies an Argon2id hash (t=3, 64 MiB, parallelism 4): about 25 ms of wall time and roughly 100 ms of CPU per sign-in. Hundreds of simultaneous sign-ins fill the single CPU.
-
Static files go through the application. A first visit loads about 22 files from
/static. They carry a one-year immutable cache header, so browsers fetch them once, but the whole site sits behind Cloudflare Access, so the edge does not absorb them for new sessions. -
Probes share the request queue.
/liveand/readywait behind user requests. With a 3-second timeout, a busy pod looks dead: readiness removes the only replica (full outage) and liveness restarts it, which drops work in progress.
| # | Change | Expected effect | Decision needed |
|---|---|---|---|
| 1 | Run at least 2–3 web replicas with 1–2 CPU each, and raise GUNICORN_WORKERS to match CPU |
Capacity grows roughly with CPU; one busy pod no longer means an outage | Yes: departs from the lean single-replica footprint |
| 2 | Make liveness tolerant of load (for example 10 s timeout, 6 failures) and readiness slower to evict (5 s timeout) | A saturated pod slows down instead of restarting and dropping work | No (chart change) |
| 3 | Serve /static from a static file server or Cloudflare cache rule, not Gunicorn |
Frees request slots for application pages on first visits | Yes: a cache rule for /static/* must bypass Access for public assets only |
| 4 | Consider OWASP's minimum Argon2id cost (t=2, 19 MiB, p=1) | About 45% less hashing time and a quarter of the memory per sign-in | Yes: a security trade-off |
| 5 | Re-run this test after 1–3, with a 10-minute hold | Steady-state page times under load, which this run could not reach | — |
- Hybrid load. 1,000 virtual users in k6 0.56 replay what a browser sends: the login form with its CSRF token, each page's HTML, first-visit static files, background notification polling, and form posts that create incidents and add work notes, with 3–8 seconds of think time. 1,000 real browsers would need about 50–100 GB of memory, so alongside them 30 real headless Chromium sessions (Playwright 1.49.1) recorded true page-load and paint times. The Chromium pod started late (image download), so only 8 browser page views were captured before the stop.
-
Inside the cluster. Load came from pods on
homeserver-02straight to the ServiceOps Service, bypassing Cloudflare. Each virtual user presented its own documentation-range client address (RFC 5737), as a real audience would. -
Isolated data. All synthetic users (1,030) and tickets lived in a separate
loadtesttenant that real users cannot see. After the run the tenant and every synthetic account were deactivated, and the temporary NetworkPolicy, Jobs, Secret and ConfigMap were deleted. - Measurements. k6 per-request samples, Chromium Navigation Timing and Largest Contentful Paint, and web/worker/PostgreSQL CPU and memory from each container's cgroup counters every 10 seconds.
-
Reproduce.
provision.pycreates the isolated tenant and users,browser_flows.jsis the k6 script,real_browsers.pydrives Chromium, andanalyze.pydraws these graphs. The raw summary issummary.json. The test password comes from theLOADTEST_PASSWORDenvironment variable; none is stored here.
Running this test against production takes production down at the current size; repeat it against a scaled deployment or an isolated copy.