Repository navigation
Retirement
Monthly income at each possible retirement age, in today's dollars, compared with what you'll probably spend in retirement.
- Retirement age
- The income breakdown
- The chart
- The table
- Income sources
- Assumptions
- Today's dollars
- Limitations
The big slider is the first partner's retirement age. Everyone in the household retires in that same calendar year, so other partners' ages at retirement follow from their age today. The line next to it shows the year and how many years from now.
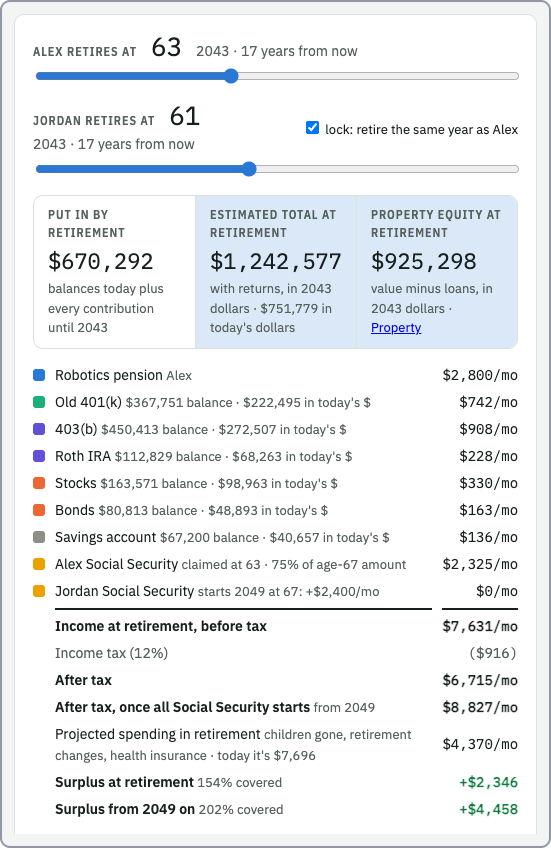
For the chosen age:
- One line per income source, with details (balance at retirement, claiming age…).
- Income at retirement, before tax, then income tax at the retirement tax rate (Spending Over Time) and after tax.
- After tax, once all Social Security starts, if someone claims later than retiring.
- Projected spending in retirement from Spending Over Time: children gone, retirement changes, health insurance, and taxes that continue (e.g. property tax).
- Gap / surplus at retirement and from the year all Social Security has started, with "% covered".
- One stacked bar per retirement age (55 to 70 by default, or from your age today if you're past 55).
- Pensions: blue.
- Your accounts: green.
- Other partners' accounts: purple.
- Investments: orange.
- Social Security: yellow.
- A dashed outline on top is Social Security that starts later than retiring.
- Solid dark marks: projected retirement spending for that age.
- Dotted orange line: what you spend today.
- Hover for details; click a bar to pick that age.
Selected ages (55, 58, 60, 62, 65, 67, 70 and the age you picked) with everyone's ages, the year, income by type, income after tax, after all Social Security starts, projected spending and the long-run gap. Click a row to pick that age.
Each has a panel on the right. Untick a panel's checkbox to leave it out (it fades).

From Settings › Household (pensions in the config):
- Estimates by age (e.g. 55, 60, 65 from your pension's estimate tool). Ages in between are interpolated in a straight line; before the first age the pension pays nothing.
- After the last age it stays flat, or, if you gave years of service today, grows in proportion to years of service.
- If the pension depends on final pay (
grows_with_raises, on by default), it also grows with the partner's real raises. - Or a single flat monthly amount.
401(k), 403(b), IRA and similar: balance today and adding per month (contributions continue until retirement). The balance grows at the investment return and becomes monthly income at the withdrawal rate.
Brokerage / stock accounts from Settings › Savings & income:
- Balance today and its own return rate (separate from the presets; 0% means off until you pick one).
- Adding per month comes from the investment's line in the planner and stops at retirement.
- The panel fades until there's a balance or a monthly amount, and warns when the return is below inflation (the money loses buying power).

- Amount at 67 per partner, in today's dollars. Get real figures from your Social Security statement (ssa.gov); the defaults are placeholders.
- Claims at: "when retiring (62+)" or a fixed age 62–70. A benefit starts at the chosen age, or at retirement if that's later.
- Claiming at 62 pays 70% of the age-67 amount; waiting until 70 pays 124%.
| Setting | Meaning |
|---|---|
| Yearly raise (per partner) | Raise above inflation until retirement. 0% = pay keeps pace with inflation. Also grows final-pay pensions. |
| Presets | Pessimistic 4.5% / 3.5%, Mid 5.5% / 3%, Optimistic 7% / 2.5% (return / inflation) by default. |
| Investment return | Growth of retirement accounts. |
| Inflation | Used to convert to today's dollars. |
| Yearly withdrawal from savings | Share of balances taken each year in retirement (4% is a common rule of thumb). |
| Reset retirement inputs | Back to the starting values from your settings. |
Everything here is adjusted for inflation, so amounts compare directly with what you spend now: balances are grown at the return rate and divided by inflation over the same years. Pension estimates are treated as today's dollars.
- One flat tax rate; no early-withdrawal penalties, required minimum distributions or Medicare costs.
- Withdrawals are a fixed percentage; the model doesn't run balances down over time.
- Everyone retires in the same year.