Repository navigation
Spending Over Time
How monthly spending changes year by year as children leave home and after you retire, against income each year.
- The yearly chart
- Today's dollars or with inflation
- The stages table
- Category changes
- Retirement costs
- What's built in
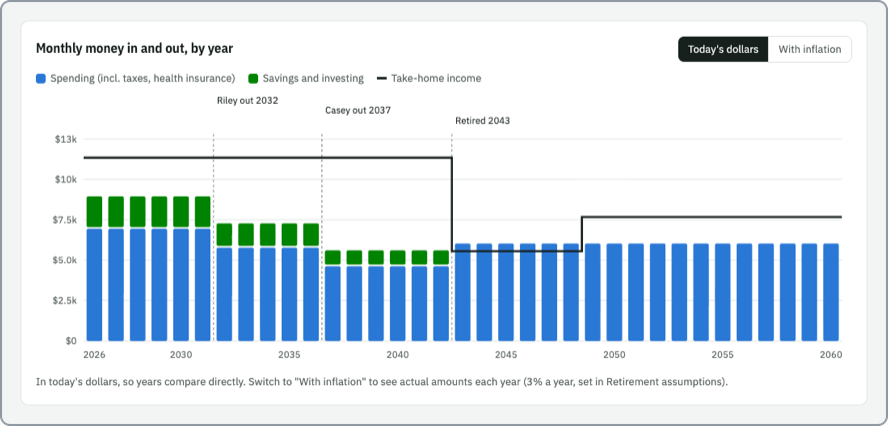
35 years starting this year. Each year shows:
- Blue bar: spending (living costs, taxes set aside, retiree health insurance).
- Green bar on top: savings and investing.
- Dark line: take-home income (pay, then retirement income after tax).
- Dashed markers: when each child finishes high school and when you retire.
Hover a year for the breakdown, everyone's ages and what's left over.
- Today's dollars (default): adjusted for inflation so years compare directly.
- With inflation: the actual amounts in each year's money, at the inflation rate set in Retirement assumptions.
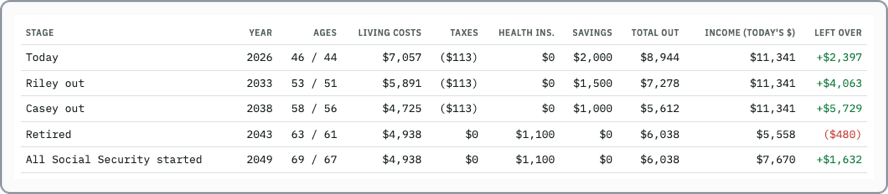
One row per life stage: today, each child out of the house (the year after graduating), retired, and "all Social Security started" if that's later. Columns: year, ages, living costs, taxes, health insurance, savings, total out, income and what's left over.
The balance of every 529, savings account, emergency fund and investment at the start of each stage (529s until college starts), and the year each savings account with a max reaches it. See How the numbers work.
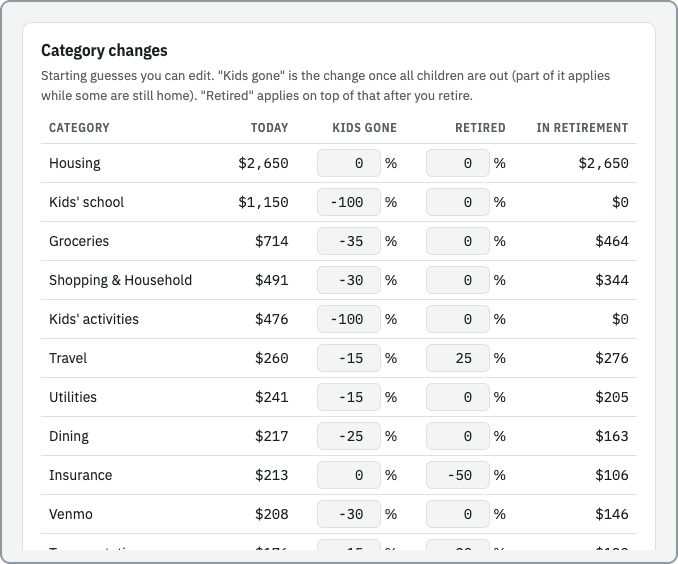
Every regular category with two editable percentages:
| Column | Meaning |
|---|---|
| Kids gone | Change once all children have left home. While some are still home, a proportional share applies (half the change when one of two has left). |
| Retired | Change after retiring, applied on top of the kids-gone change. |
| In retirement | The resulting monthly amount in your first year of retirement. |
The starting values come from each category's kids_gone_pct and retired_pct
(Categories). Typical ideas: kids' school −100%, groceries −35%, travel +25% in
retirement, transportation −20%. Reset these guesses returns to the starting values.
| Setting | Meaning |
|---|---|
| Health insurance after retiring | Monthly premium once employer coverage ends. Added from retirement on. |
| Income tax rate in retirement | One overall rate applied to retirement income (10–15% is a common rough figure). |
- Each child's 529 contribution stops at their high-school graduation.
- Savings accounts marked
stops_at_retirement, investment contributions, and credits or costs not markedin_retirementstop when you retire. - Contributions set as "% left" are worked out again each year from that year's left-over.
- Emergency costs come out of the emergency fund; the tooltip shows any part it can't cover, which counts as spending that year.
- Taxes marked
in_retirement(e.g. property tax) continue. - Income before retirement is today's take-home pay, keeping pace with inflation plus each partner's yearly raise.
Formulas: How the Numbers Work.