Admin Charts
- Configuration of the report
- Add Data Visualization links to Metadata Apps configuration
- Manage Data Visualization Configuration
- Access to Charts configuration page
- Access to Charts visualization page
- Configure permissions for charts
- Location-based chart data
To configure data visualization (charts), you need to have at least one report configured in Report Administration
-
The reporting administration can be found using the following path from the home page: System Administration -> Advanced Administration -> Manage Report Definitions section -> Report Administration link.

Links to data visualization and data visualization configuration should be on the Configure Metadata page in the CFL section.
-
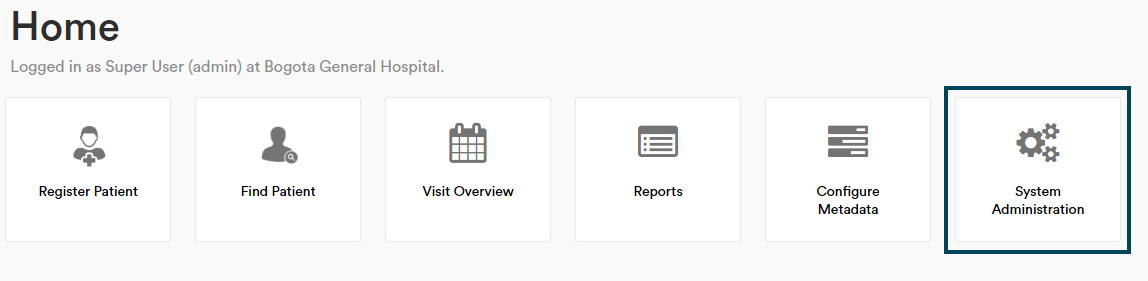
From Home page enter System Administration.
-
Then enter Manage Apps.

-
Find cflui.configureMetadataApps and edit it by clicking the pencil icon.

-
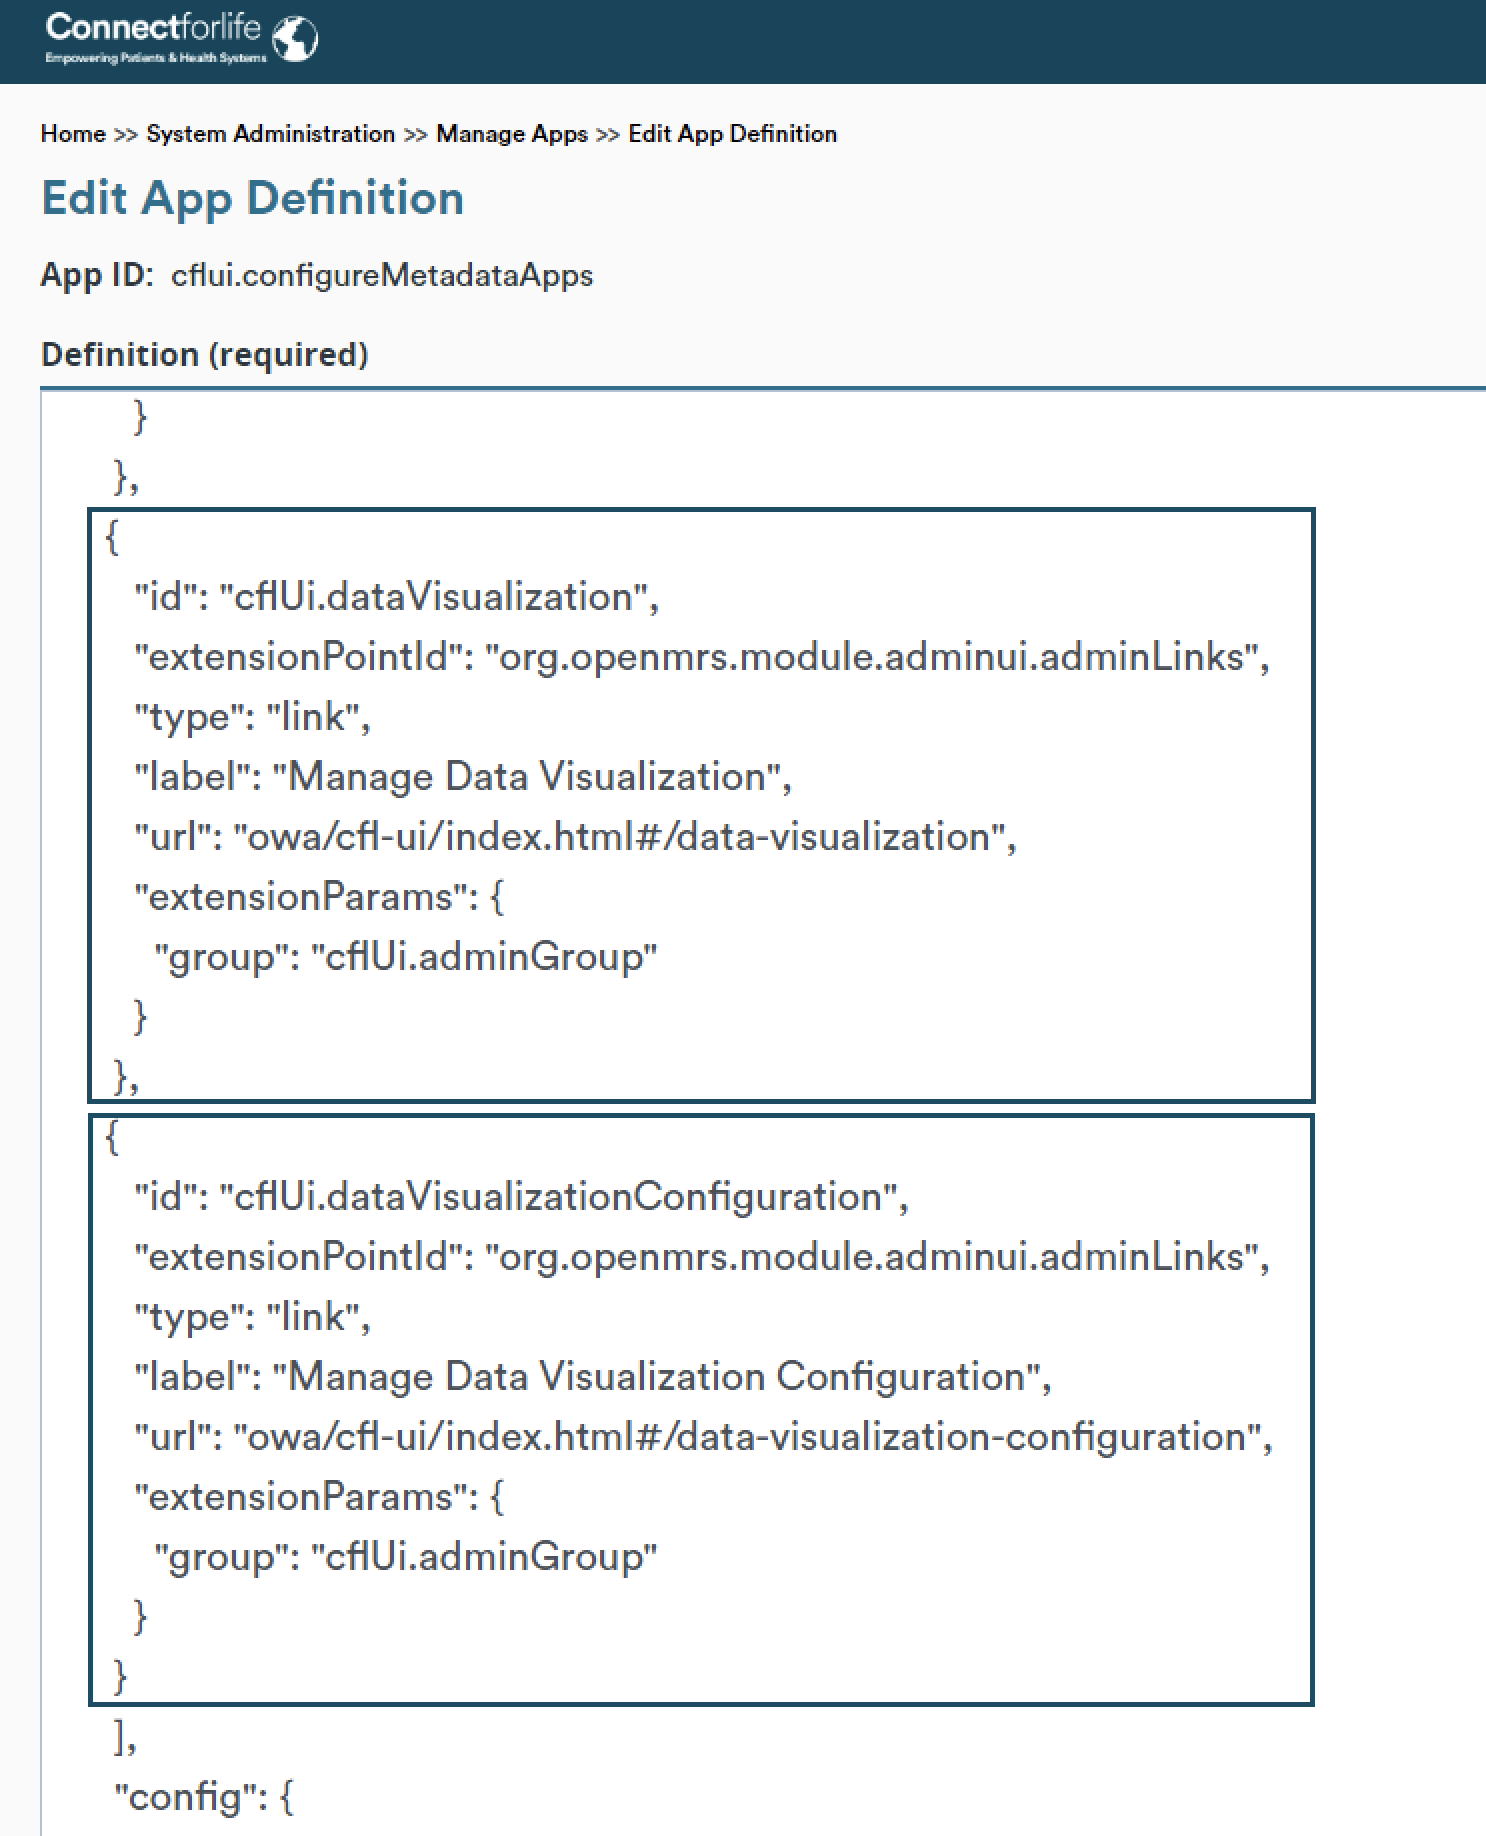
Inside "Extentions" add two links:
- First for manage data visualization configuration
{ "id": "cflUi.dataVisualizationConfiguration", "extensionPointId": "org.openmrs.module.adminui.adminLinks", "type": "link", "label": "Manage Data Visualization Configuration", "url": "owa/cfl-ui/index.html#/data-visualization-configuration", "extensionParams": { "group": "cflUi.adminGroup" } }- Second for manage data visualization page
{
    "id": "cflUi.dataVisualization",
    "extensionPointId": "org.openmrs.module.adminui.adminLinks",
    "type": "link",
    "label": "Manage Data Visualization",
    "url": "owa/cfl-ui/index.html#/data-visualization",
    "extensionParams": {
        "group": "cflUi.adminGroup"
    }
}
-
Click Save button.
Manage Data Visualization Configuration page is used to configure selected reports. It is not necessary to configure all of the provided reports in global property cflui.reportsForDataVisualizationConfiguration.uuid.list, but at least one report should be properly configured to be able to see the result on the Manage Data Visualization page.
-
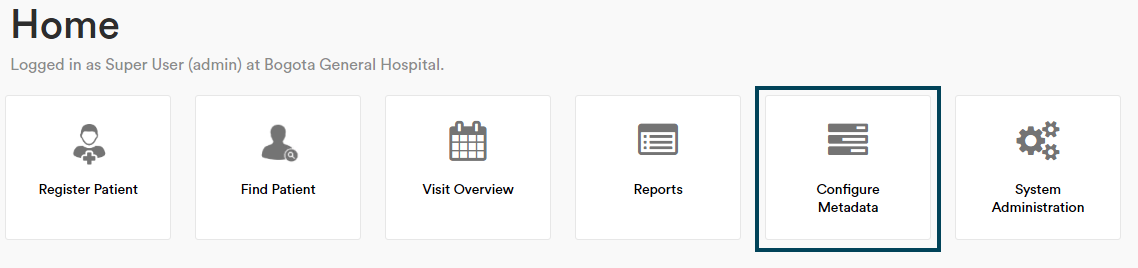
From Home page enter Configure Metadata.
-
Then enter Manage Data Visualization Configuration in CFL section.

-
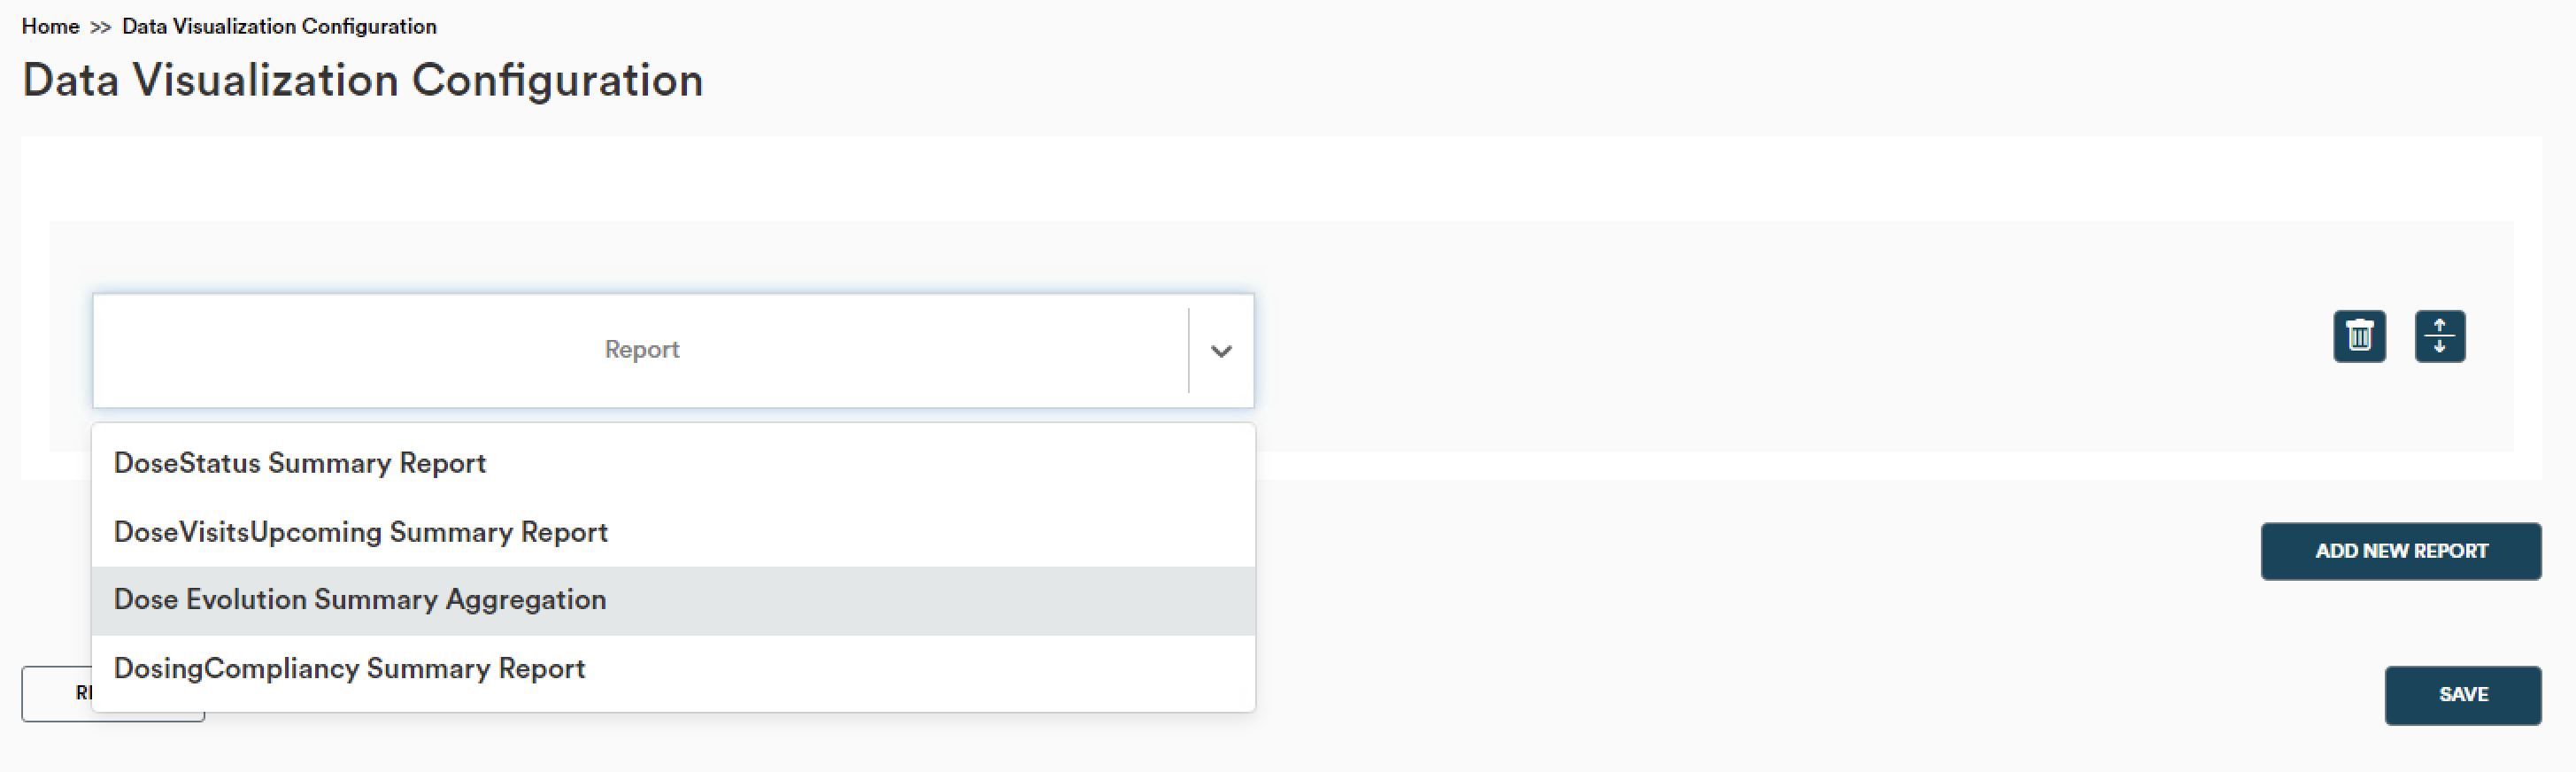
First, select the report you want to configure.
-
Click the expand button to see details (all report which are configured in Reports Administration).
-
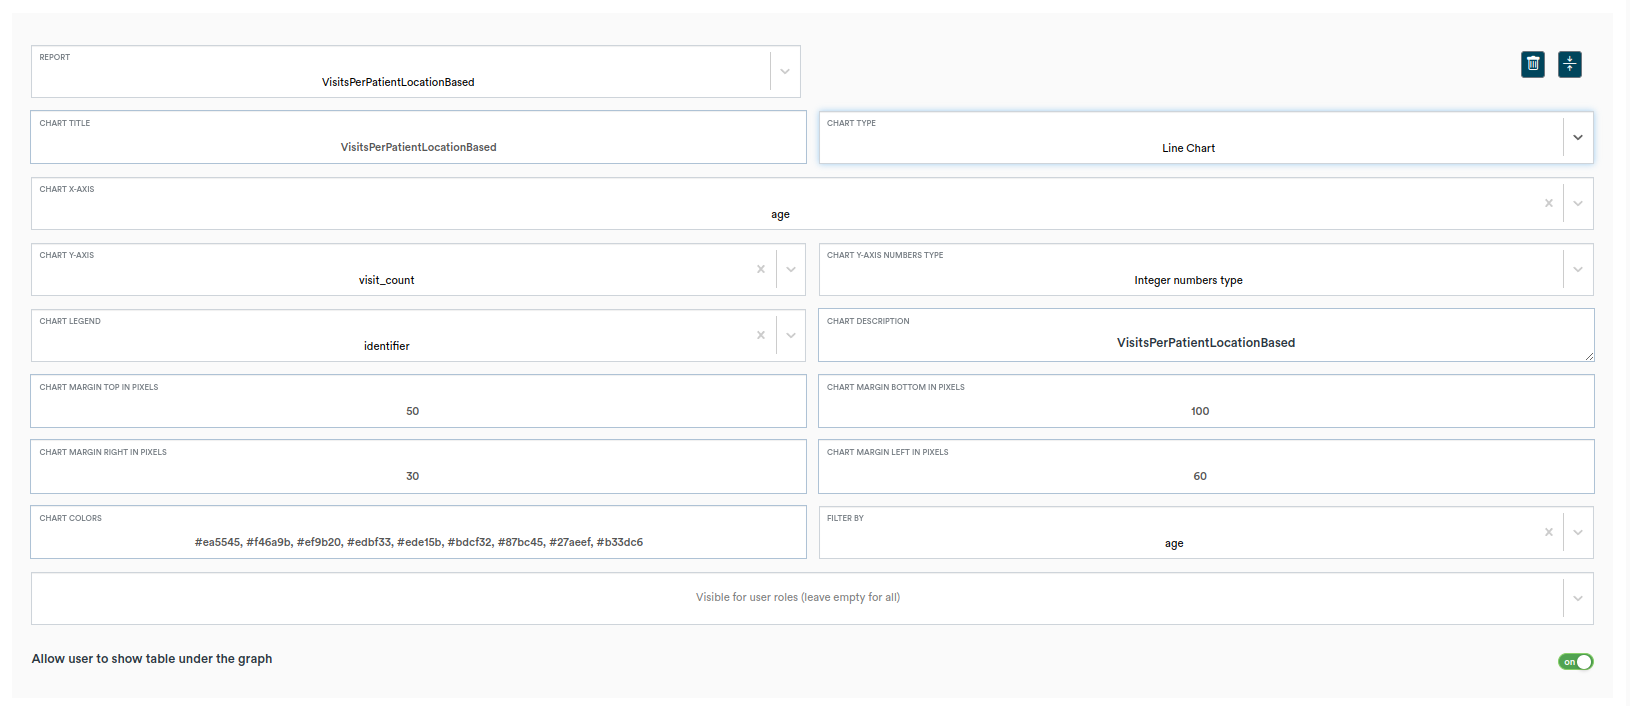
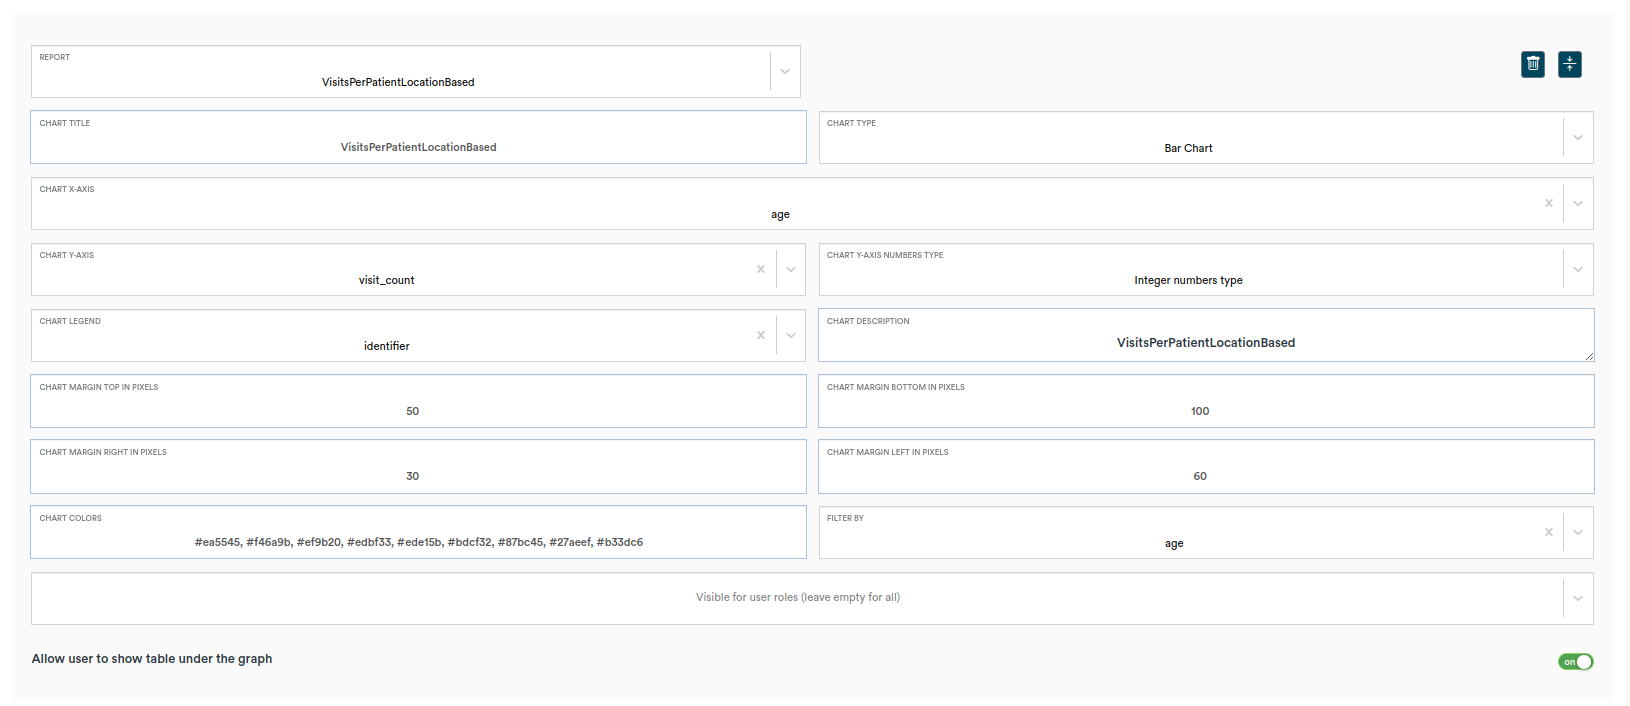
Chart title is pre-filled by default and is the same as report name. It is possible to change it.
-
Chart type selectable from Bar or Line Chart.
-
X-Axis, Y-Axis, Legend select with options corresponding to the name of columns in the database for a given report.
-
Y-Axis Numbers Type, select with options in which we declare what type of numbers (Integers or Decimals) should be use in Y-Axis.
-
Chart description, pre-filled by default if provided on the Home -> System Administration -> Advanced Administration -> Manage Report Definitions -> Report Administration page, the ability to change to another, the only optional field that may be empty.
-
Inputs with margins and colors, pre-filled with the possibility of changing.
-
Switch button 'Allow user to show table under the graph' allows admin to decide if table under the graph will be shown for user.
-
The add new report button creates a new, empty section for the next report to select and configure.
-
Blank or incomplete report cannot be saved.
-
The return button takes you to the previous page without saving your configuration.
-
The save button saves the configuration if all fields except the description are filled, otherwise an error message appears and empty fields are highlighted.
To protect access to Charts configuration page from unauthorized users we have to include appropriate privelege in app definition. This privelege is named Configure Charts.
Configuration of 'Report Visualization' section in 'Configure Metadata' page may look like this:

The result of this configuration is:

So only users with Configure Charts privilege will see link to Charts configuration page.
To protect access to Charts visualization page from unauthorized users we have to include appropriate privelege in app definition. This privelege is named View Charts.
Configuration of 'Visualization' tile on Home page page may look like this:

The result of this configuration is:
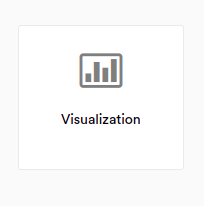
So only users with View Charts privilege will see this tile on Home page.
We can configure which charts will be visible for which user roles. How to do it?:
- Go to the Charts configuration page.
- Expand report section.
- Select roles for which given chart will be shown. You can do it in Visible for user roles (leave empty for all) multiselect field.

After that save configuration. From this moment chart will be only visible for users who have roles configured in 3. point.
Example:
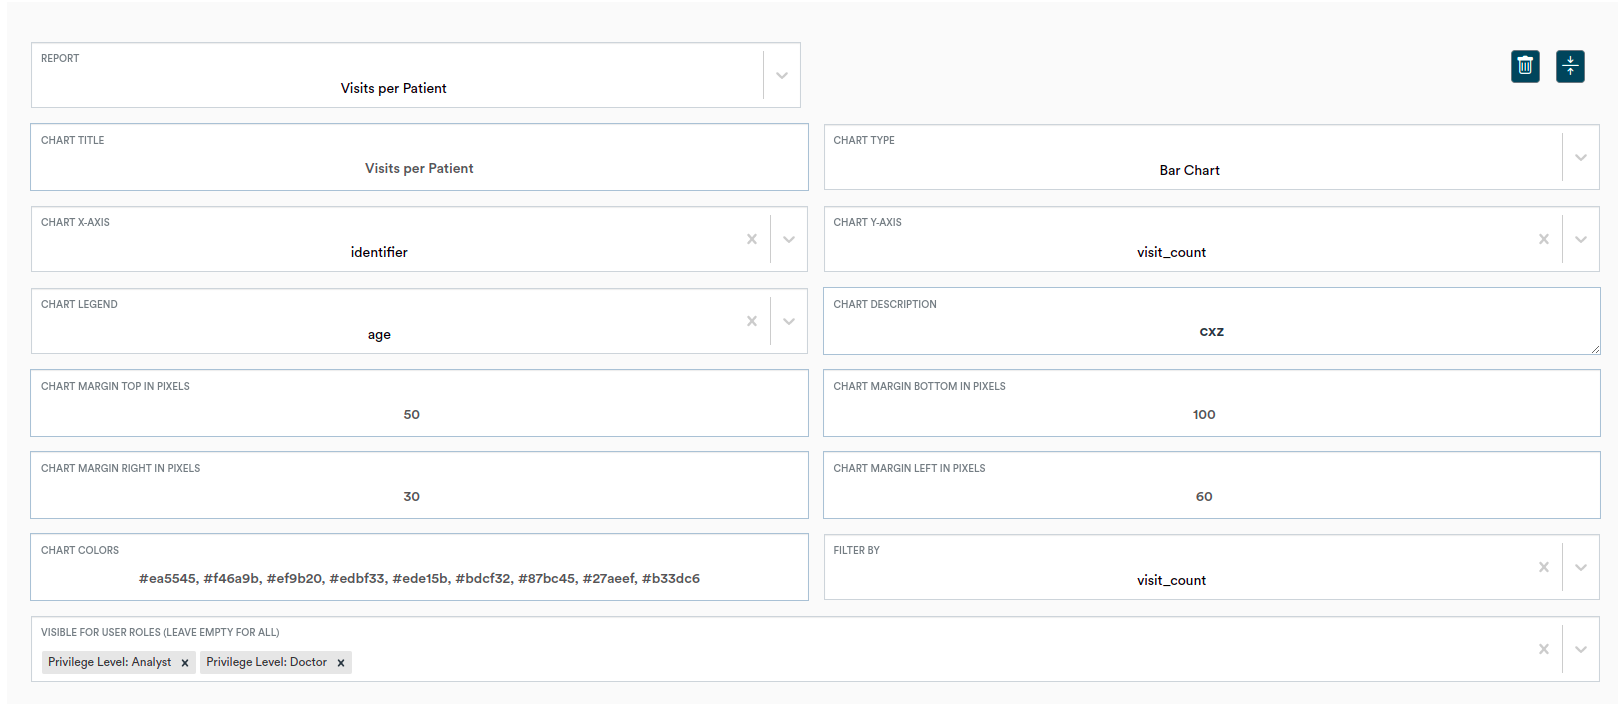
Based on screen above only users with 'Privilege Level: Analyst' and 'Privilege Level: Doctor' roles will be able to see this chart.
If we leave this multiselect field empty then all users will be able to see this chart.
The source of chart's data is an OpenMRS report. It is possible to create separate reports and charts for different locations, and using role-based access to show the charts only to the specific users, but it might not be most convenient. The charts module provides a way to make a single chart with a single report, that shows data from the user's login location only.
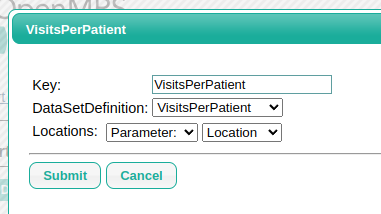
To allow charts module to show only data from user's login location, the chart's report must have a location filter. The location filter must be named locationIds and must support a set of values.
The charts module ensures that the location filter is set with user's login location. For a user with System Developer role (usually only admin) all locations in the system are set, meaning System Developer will see all data.
- The SQL Data Set must have locationIds parameter. Actually, at this step the name doesn't matter yet, but it's good to have it consistent. Some entities in OpenMRS reference Locations directly (like Visit), others indirectly (like Patient has a reference to PatientIdentifer which references Location), it's up to the author of the SQL Data Set to properly implement the filter. Example below shows an SQL query with Patients filtered by their location, take note the SQL's IN operator is used.

- When creating Report Definition, you need to create a parameter with the exact name: locationIds.
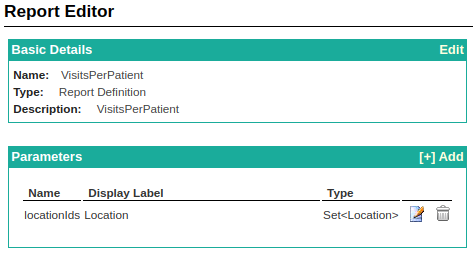
- Also remember to properly map parameter from Report Definition to parameter in the Data Set.