Admin Reports
The reporting administration can be found using the following path from the home page: System Administration -> Advanced Administration -> Manage Report Definitions.

Go to "Data Set Definitions". Here you can use the datasets that already defined for you and continue on those tables for the reports or build a new one. To create a new dataset, the best way is to create an SQL dataset and write the SQL that would retrieve the data that you want from the database. The database model and tables are similar to the standard OpenMRS model as well as the relationships between the tables. It is recommended to use MySQL workbence (or another database UI tool) to first explore and create your query there and then copy/paste the query in OpenMRS.

Go to "Report Administration". Here you can edit or create new reports that use the defined datasets in OpenMRS. The report will use the output of the dataset as input and depending on the format you choose, will render it in that format. Choose "Custom Report (Advanced)".

Define the "Name" and a "Description" of the report and click "Submit".
First select the dataset(s) you want to work on by adding a dataset of OpenMRS (like the one you created above).

Then choose the format you need. If you just need an export of the dataset, you can choose "CSV" or "Excel (Default)" and the report will generate the full dataset in that format. If this is enough, you can save the report and immedialy go to "(Configure Reports in UI)(#configure-reports-in-ui)". If you want to use an Excel template, go to "(Excel Templates)(#excel-templates)"

The reporting administration can be found using the following path from the home page: System Administration -> Manage Apps -> cfl.reportingui.reports -> edit

This will open the JSON file that defines the UI.
The first part of the JSON defines the structure of the UI. Here you can see that two categories will be created "overview" and "dataexports".


To add or edit a new report in the UI, you need to define in which category/structure it needs to be as well as the name of the report and the report ID.

To get the report ID of a report, you can go to report administration and click the pencil icon to edit.

In the URL link you can find the report ID.

If you selection Excel Template, you have more options to configure beside the name of the report. You also need an Excel file that will be used as template for the data and define how the data should be exported to that Excel file.
The Excel template line is where you need to put your Excel. You can also download the current one by click on the name and it will download the current Excel being used. If you want to upload a new one, press "Change" and browse to your new Excel file.
In the repeating section you need to define where in the Excel the data will be written to and which dataset needs to be used. Use the dataset name that you selected. In the picture below, the data will be written on sheet 2 of the Excel starting from row 2 and use the "DoseEvolution" dataset.


You need to define where OpenMRS needs to put the data from the query, you can do this in Excel with referencing the specific OpenMRS dataset followed by the column name after a “.”. OpenMRS will start the output of the values for that column on that cell. The references can be found in the data sheet of the Excel template.
In the case below, the field "Report date", will be mapped to column A and will start from row 2. "Report date" is a field that exists in the dataset that you defined in OpenMRS.

To make the pivot table and charts in your Excel dynamic, we need to define the input range of the data to be used in tables and charts. To avoid blanks in the table or having to set the range fixed. We use a dynamic range based on a formula to create the input table. In the reports, this table is stored as “PivData” and can be viewed in the formula pane under defined names. PivData is defined as =OFFSET(Data!$A$1;0;0;COUNTA(Data!$I:$I);12). It counts the number of rows in column I that are not empty and uses that to define the number of rows. It starts from A1 and selects the first 12 columns starting from A1 (the “12” in the formula) and goes the defined number of rows done based on the count.

We use the table range in the pivot table to get the functionalities of the pivot table for the visuals. This allows us to have a slicers and timelines. All the PivotTables and PivotCharts in the Excel file use the same table range created by the formula so any changes will be available for all.
Once we have the data we can add slicers and timelines. Slicers and timelines can be added to PivotTables and PivotCharts. They will make it possible for the user to filter and defilter data in a user friendly way. After adding the slicer and timeline, you can do some formatting by selecting the slicer and go to the specific slicer pane.

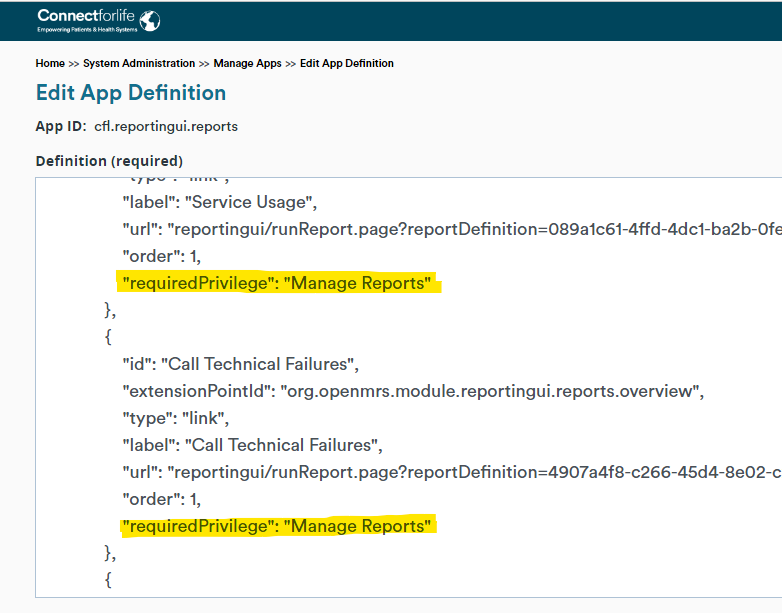
For each report, the admin needs to define which roles can access these reports in the report definition. This configuration is done in the reportingUI.app definition. Per report and report section header can be assigned to different roles so that granular access can be given.
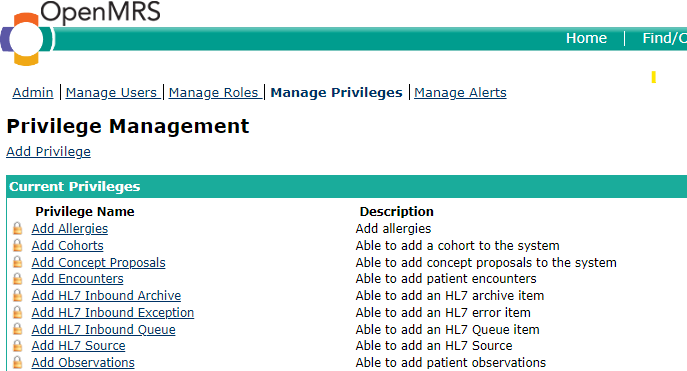
Roles and Privileges can be created in the advanced administration page, where you can group certain privileges levels into one role and create privileges depending on the different reporting needs.