Home
Welcome to the official user guide for the SONLab FRET Analysis Tool, an open-source desktop application for analyzing Fluorescence Resonance Energy Transfer (FRET) microscopy data. It combines deep-learning cell segmentation (Cellpose) with standardized pipelines for bleed-through correction and FRET efficiency calculation, so that protein–protein interaction studies can be performed reproducibly and with minimal manual bias.
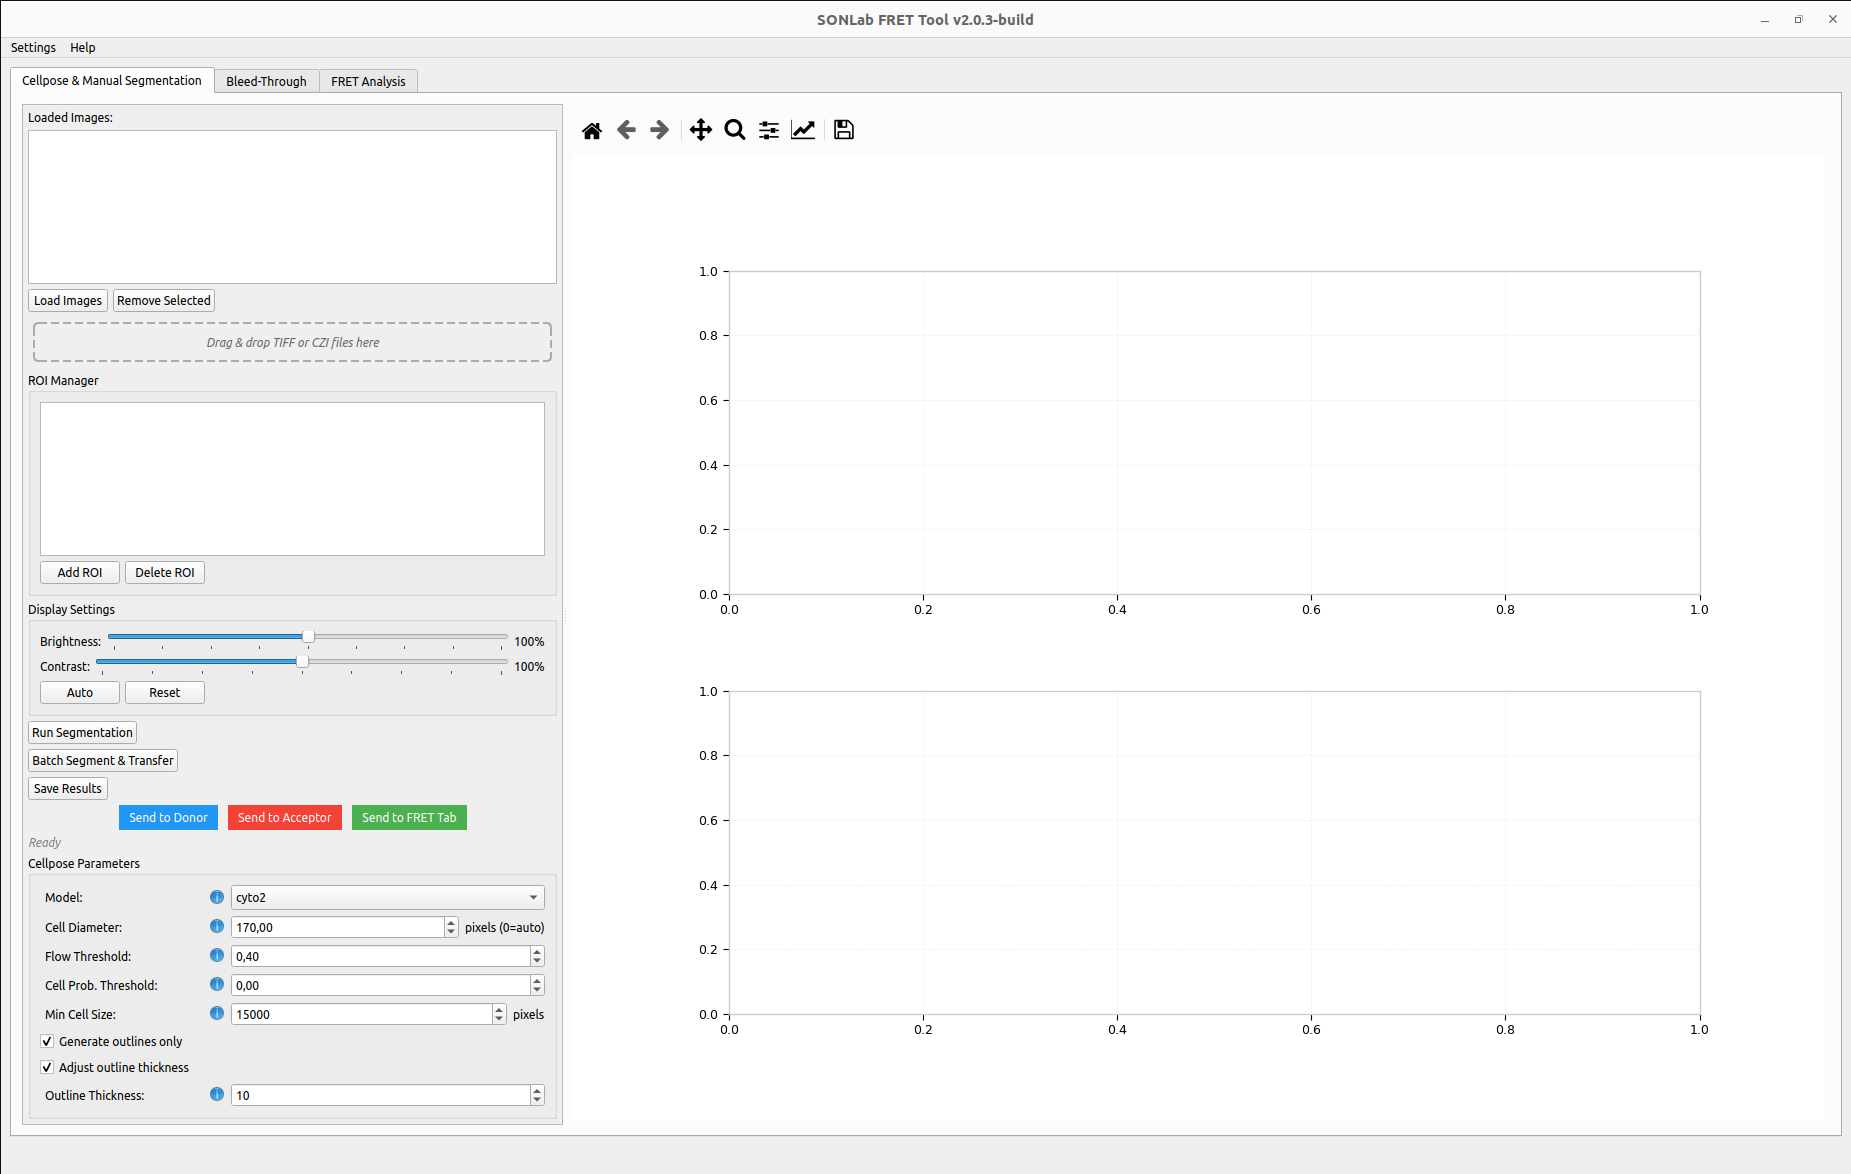 The main window, shown on the Cellpose & Manual Segmentation tab.
The application is organized as a pipeline, one tab per stage:
- Cellpose & Manual Segmentation — detect and segment cells, refine the result by hand, and forward the segmented stacks to the next stages.
- Bleed-Through — measure the spectral cross-talk coefficients (S1–S4) from single-label control images and fit a correction model.
- FRET Analysis — compute pixel-wise FRET efficiency with the corrected data, group images by condition, and produce publication-ready statistics and figures.
- Intensity / Densitometry — object-based intensity analysis of segmented cells (membrane vs whole-cell enrichment, integrated density, CTCF) to check protein localization. Independent of the FRET pipeline.
A typical FRET session moves left-to-right through the first three tabs. See Workflows and Data Flow for the end-to-end picture.
| Page | What you will find |
|---|---|
| Installation | Installer and manual setup for Windows, Linux, and macOS |
| User Interface Overview | The main window, tabs, menus, theming, and the walkthrough |
| Segmentation | Loading images, Cellpose parameters, running, manual ROI editing, and transfer |
| Bleed-Through Correction | Channels S1–S4, processing settings, fitting models, save/load parameters |
| FRET Analysis | FRET settings, formulas, DFRET calibration, grouping, and running the analysis |
| Intensity and Densitometry | Membrane-vs-whole-cell intensity, integrated density and CTCF for segmented cells |
| Results and Visualization | Efficiency maps, statistics tables, histograms, box plots, and the statistics engine |
| Workflows and Data Flow | How data moves between tabs, recommended end-to-end workflows |
| File Formats | Input and output file structures (TIFF frame layout, JSON, CSV) |
| Troubleshooting and FAQ | Common problems and their solutions |
-
Inputs: multi-frame
.tif/.tiffand Zeiss.cziimages containing FRET, Donor, and Acceptor channels. -
Segmentation: Cellpose models (
cyto2,cyto,nuclei,tissuenet,livecell) with manual polygon refinement. - Bleed-through: donor (S1), acceptor (S2) and optional S3/S4 channels; Constant, Linear, or Exponential fit.
- FRET formulas: FRET/Donor, FRET/Acceptor, Xia et al., Gordon et al., PixFRET, and DFRET.
- Statistics: assumption-checked significance testing (Welch / non-parametric) with per-group comparisons.
- Outputs: efficiency maps (TIFF), statistics (CSV), figures (PNG/PDF), and reusable parameter files (JSON).
If you use this tool in your research, please cite:
Nursoy, A. Z., Cevheroğlu, O., & Son, Ç. D. Automated FRET Analysis for Enhanced Characterization of Protein–Protein Interactions. Microscopy Research and Technique. https://doi.org/10.1002/jemt.70147
- Open an issue or start a discussion on the project's GitHub repository.
- Email:
sonlab@metu.edu.tr