Segmentation
The first tab detects and segments cells using the Cellpose deep-learning models, lets you refine the result by hand with polygon ROIs, and forwards the segmented image stacks to the Bleed-Through and FRET tabs.
Segmentation produces a label mask — an image where every pixel of a given cell shares the same integer label (1, 2, 3, …) and background is 0. This mask is stored as the first frame of the saved stack and is what every downstream calculation uses to know which pixels belong to which cell.
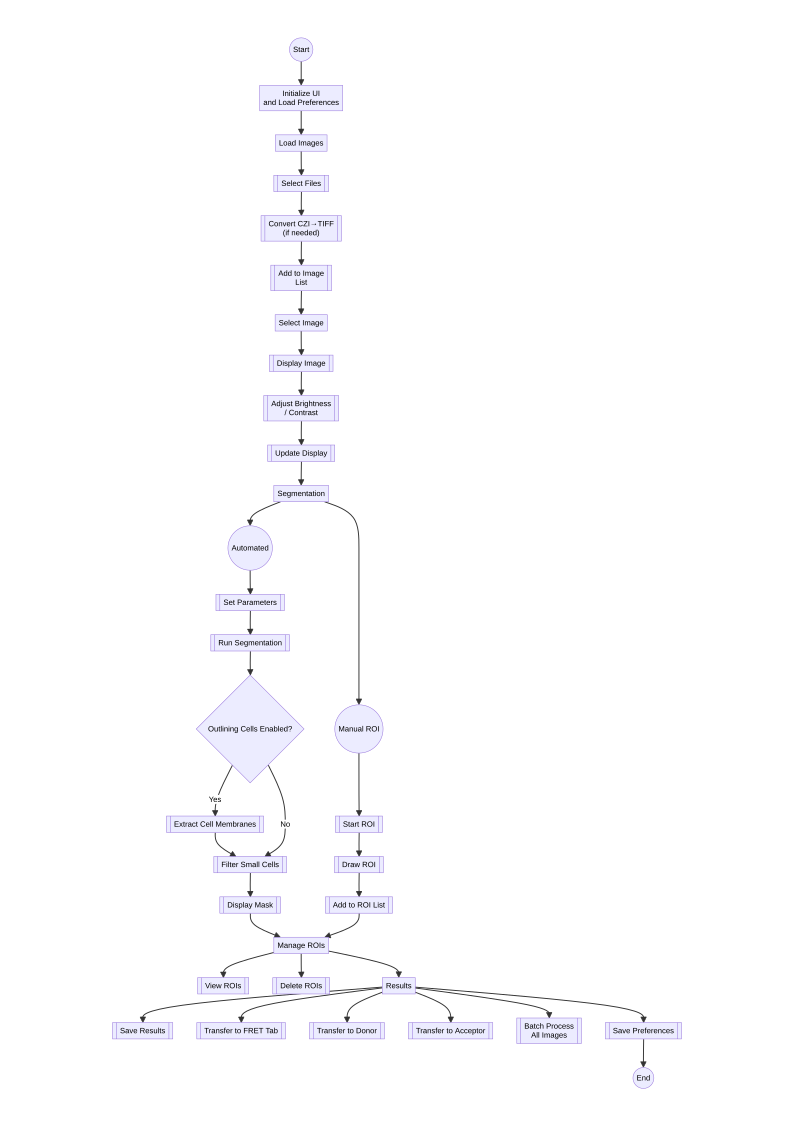
Flow of the segmentation stage, from loading images to transferring the segmented stacks.
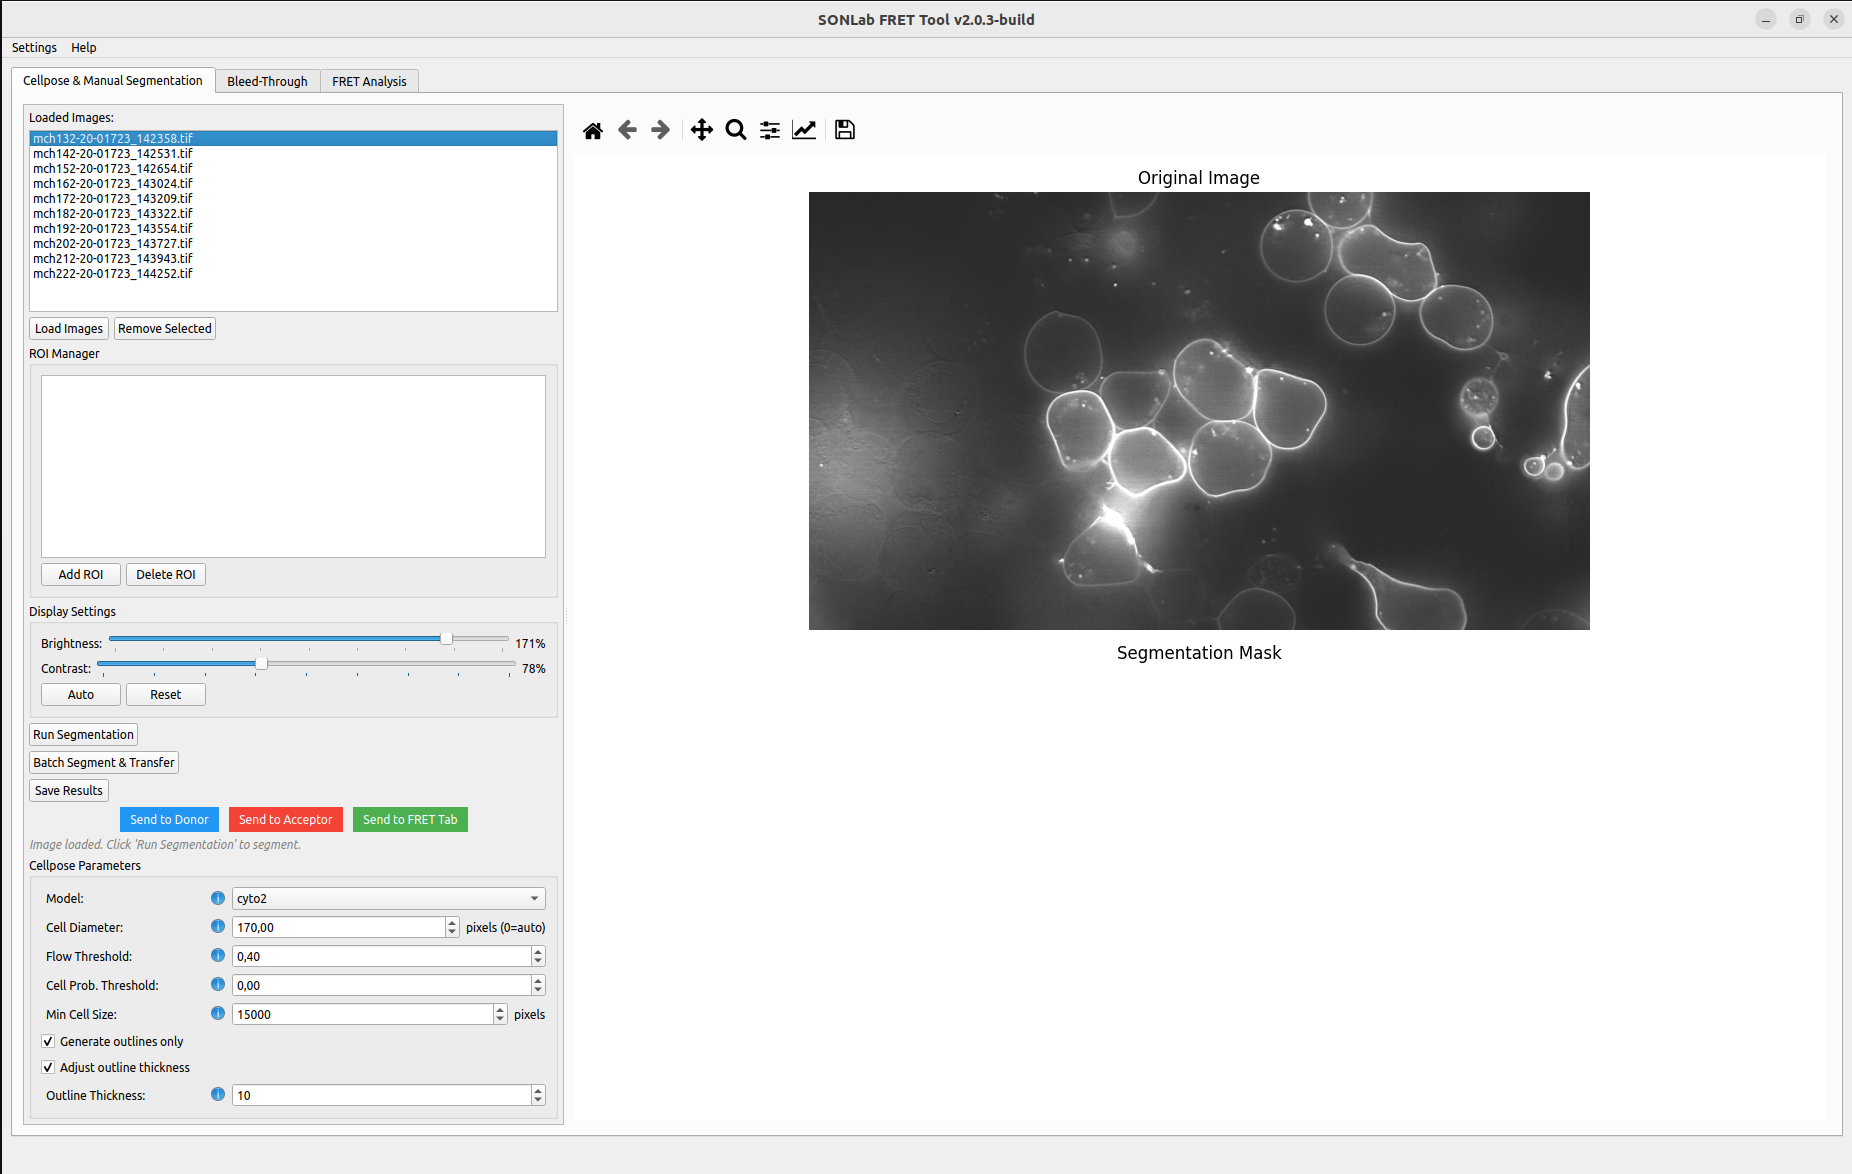 The Segmentation tab: image list and Cellpose parameters on the left; the original image and the (empty) segmentation mask area on the right.
- Click Load Images to choose one or more files, or drag & drop them onto the Drag & drop TIFF or CZI files here area.
- Supported inputs: multi-frame
.tif/.tiffand Zeiss.czi. - CZI files are converted automatically to a multi-frame TIFF (FRET, Donor, Acceptor) on load. See File Formats for the frame layout.
- Loaded files appear under Loaded Images. Select an item to display it. Use Remove Selected to drop images; when the list becomes empty the view returns to a blank state.
Found in the Cellpose Parameters panel. Hover the ⓘ icon next to each control for an inline reminder.
| Parameter | Default | Range | Description |
|---|---|---|---|
| Model | cyto2 |
cyto2, cyto, nuclei, tissuenet, livecell
|
The Cellpose model. cyto2 works well for most whole-cell segmentation tasks; use nuclei for nuclear stains. |
| Cell Diameter |
170 px |
0–500 | Approximate cell diameter in pixels. Set to 0 for automatic estimation. Matching this to your data is the single most impactful parameter. |
| Flow Threshold | 0.4 |
0.1–1.0 | Maximum allowed flow error per mask. Lower values are stricter (fewer, cleaner masks); higher values recover more cells but may add spurious ones. |
| Cell Prob. Threshold | 0.0 |
−6.0–6.0 | Detection probability cut-off. Lower values detect more (including faint) cells but admit more noise; raise it to keep only confident detections. |
| Min Cell Size |
15000 px |
1–100000 | Objects smaller than this (in pixels) are removed after segmentation. |
| Generate outlines only | off | — | When checked, the mask stores cell outlines instead of filled regions. Output files are prefixed outline_segmented_; otherwise whole-cell_segmented_. |
| Segment both (membrane + whole-cell) | off | — | When checked, saving/sending writes a single stack laid out as [outline, filled, ...raw channels] for the Intensity and Densitometry tab. The whole-cell mask stays on screen and editable; the outline (membrane band) is derived from it at save time. Files are prefixed both_segmented_. |
| Adjust outline thickness | on | — | Enables the thickness control below. |
| Outline thickness | 10 |
1–20 | Thickness (in pixels) of the membrane band. The band is drawn inward from the cell border by this many pixels, so it always lies inside the cell. |
Tip: if cells are merged together (under-segmentation), reduce the Cell Diameter or lower the Flow Threshold. If single cells are split into pieces (over-segmentation), increase the diameter. Remove debris by raising Min Cell Size.
The Channel Order panel declares which frame of your raw input holds each channel (FRET, Donor, Acceptor). Segmentation reorders the saved stack to the canonical [label, FRET, Donor, Acceptor] layout the Bleed-Through and FRET tabs expect, so the analysis stays correct regardless of your acquisition order. The defaults (0, 1, 2) reproduce the common FRET/Donor/Acceptor ordering. This setting does not apply to Segment both output, which keeps the raw channels in their original order for the Intensity tab.
The Metadata button opens the acquisition metadata (TIFF tags / CZI metadata) of the selected image.
These affect only the on-screen preview, never the saved data.
- Brightness and Contrast sliders adjust the displayed image.
- Auto automatically optimizes brightness/contrast.
- Reset restores the default display.
- Run Segmentation segments the currently selected image and overlays the detected cells.
- The status line (e.g. Ready) reports progress and the number of cells found.
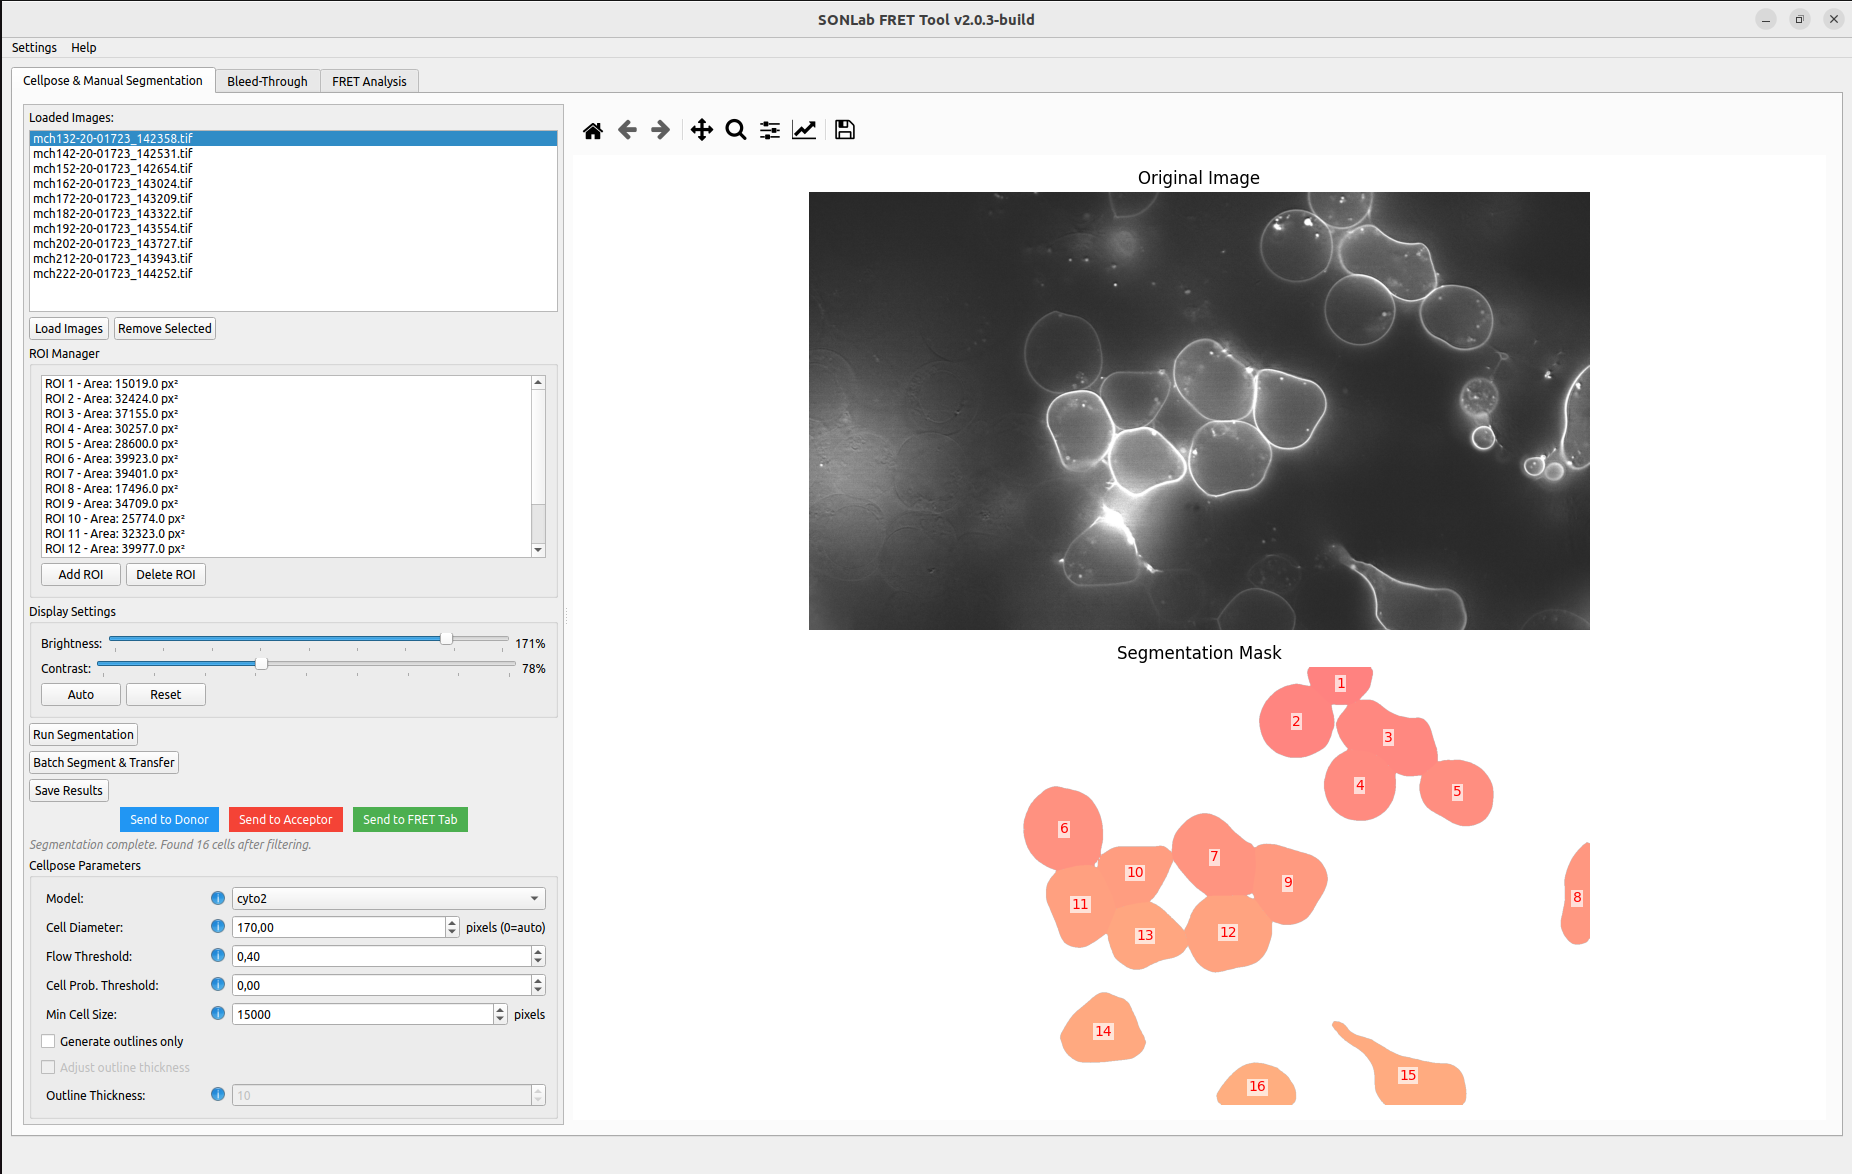 After Run Segmentation: detected cells appear as numbered labels in the mask panel, and the ROI Manager list is populated with one entry per cell.
After (or instead of) automatic segmentation, refine the mask by hand using the ROI Manager panel.
-
Add ROI — draw a custom polygon:
- Click Add ROI.
- Click on the image to place each polygon vertex.
- Close the polygon to finish. The new region is assigned the next available label number.
- Delete ROI — select a region in the ROI list and click Delete ROI.
- ROI list — shows every detected and manually added region with its label number.
Typical refinements:
- Add a missing cell by drawing a new ROI.
- Remove a wrongly segmented region by deleting its ROI.
- Split a merged cell by deleting its ROI and drawing separate ROIs for each cell.
View navigation tools (when available) — Select, Zoom (mouse wheel), Pan, and Reset View help you work precisely on the image; a separate Brightness/Contrast/Reset control adjusts the editing view.
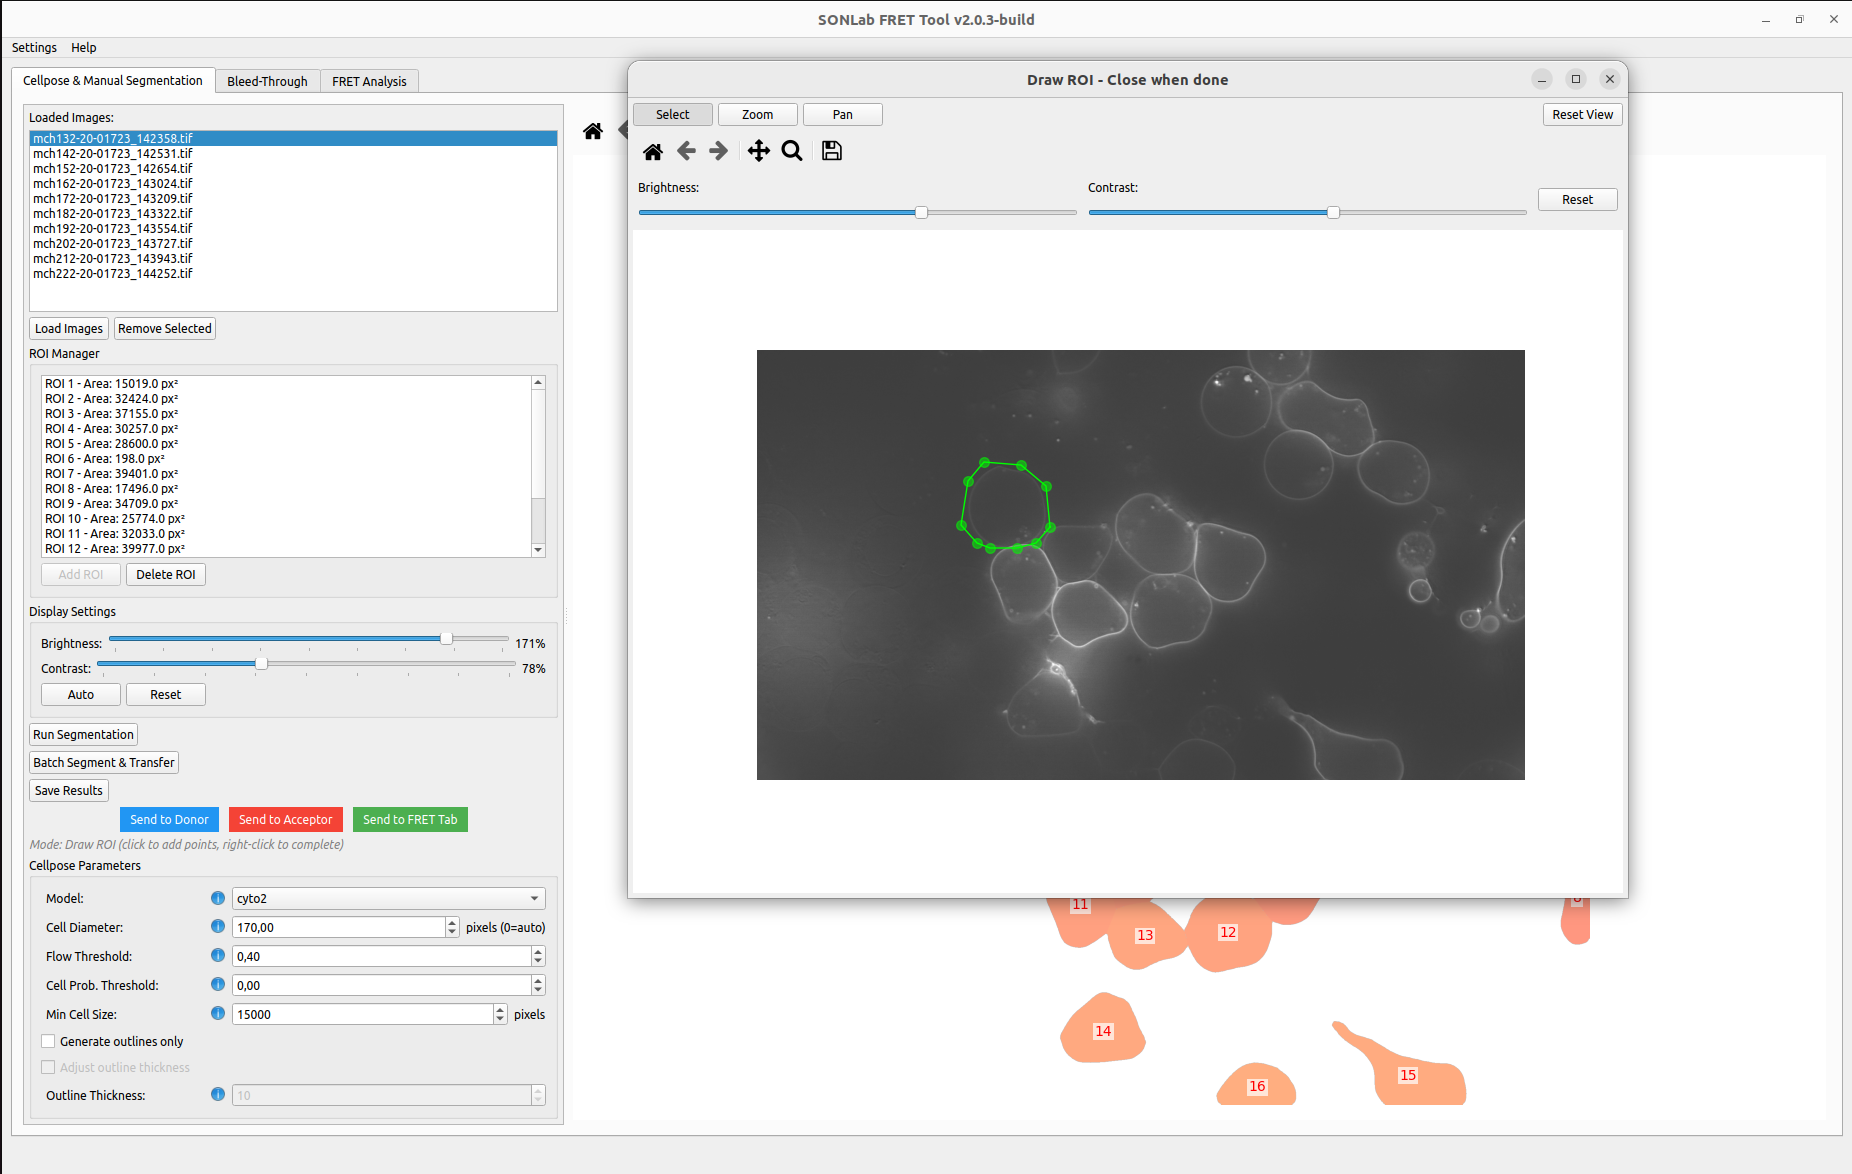 The ROI drawing window ("Draw ROI – Close when done"): click to place polygon vertices around a cell, using the Select/Zoom/Pan tools and brightness/contrast controls as needed.
Once the mask looks correct, choose how to forward it:
| Action | What it does |
|---|---|
| Save Results | Saves the segmented stack to a segmented/ folder next to the source image (mask as frame 0, then the original channels). |
| Send to FRET Tab | Saves and adds the segmented image directly to the FRET Analysis tab. |
| Send to Donor | Sends the current segmented image to the Bleed-Through Donor (S1) channel. |
| Send to Acceptor | Sends the current segmented image to the Bleed-Through Acceptor (S2) channel. |
| Send to Intensity | Saves the current segmentation and adds it to the Intensity and Densitometry tab. Enable Segment both first for membrane-vs-whole-cell analysis. |
| Batch Segment && Transfer | Segments all loaded images with the current parameters and transfers them to the FRET tab (or, in Segment both mode, to the Intensity tab), optionally tagging them with a group name. |
Note on data fidelity: the saved stacks preserve the original raw pixel intensities of every channel (no rescaling), so they can be used directly for bleed-through and FRET calculations.
Segmentation results are saved as a multi-frame TIFF with:
- Frame 0: the segmentation label mask.
- Frames 1…N: the original image channels (FRET, Donor, Acceptor) in their original order.
Files are written to a segmented/ directory beside the input image and prefixed outline_segmented_ or whole-cell_segmented_ depending on the Generate outlines only setting. With Segment both enabled the file is prefixed both_segmented_ and holds [outline, filled, ...raw channels] for the Intensity tab. See File Formats for full details.
| Symptom | Try this |
|---|---|
| Cells merged together | Lower Cell Diameter or Flow Threshold. |
| Cells split into pieces | Increase Cell Diameter. |
| Debris / tiny specks segmented | Increase Min Cell Size. |
| Faint cells missed | Lower Cell Prob. Threshold. |
| Too many false detections | Raise Cell Prob. Threshold and/or lower Flow Threshold. |
| Polygon won't complete | Make sure the ROI has at least 3 points and is closed. |
| Segmentation very slow | Use a CUDA-capable GPU if available; otherwise reduce image size or batch size. |
Continue to Bleed-Through Correction.