User Interface Overview
This page describes the main window, how to move between the analysis modules, and the application-wide settings available from the menu bar.
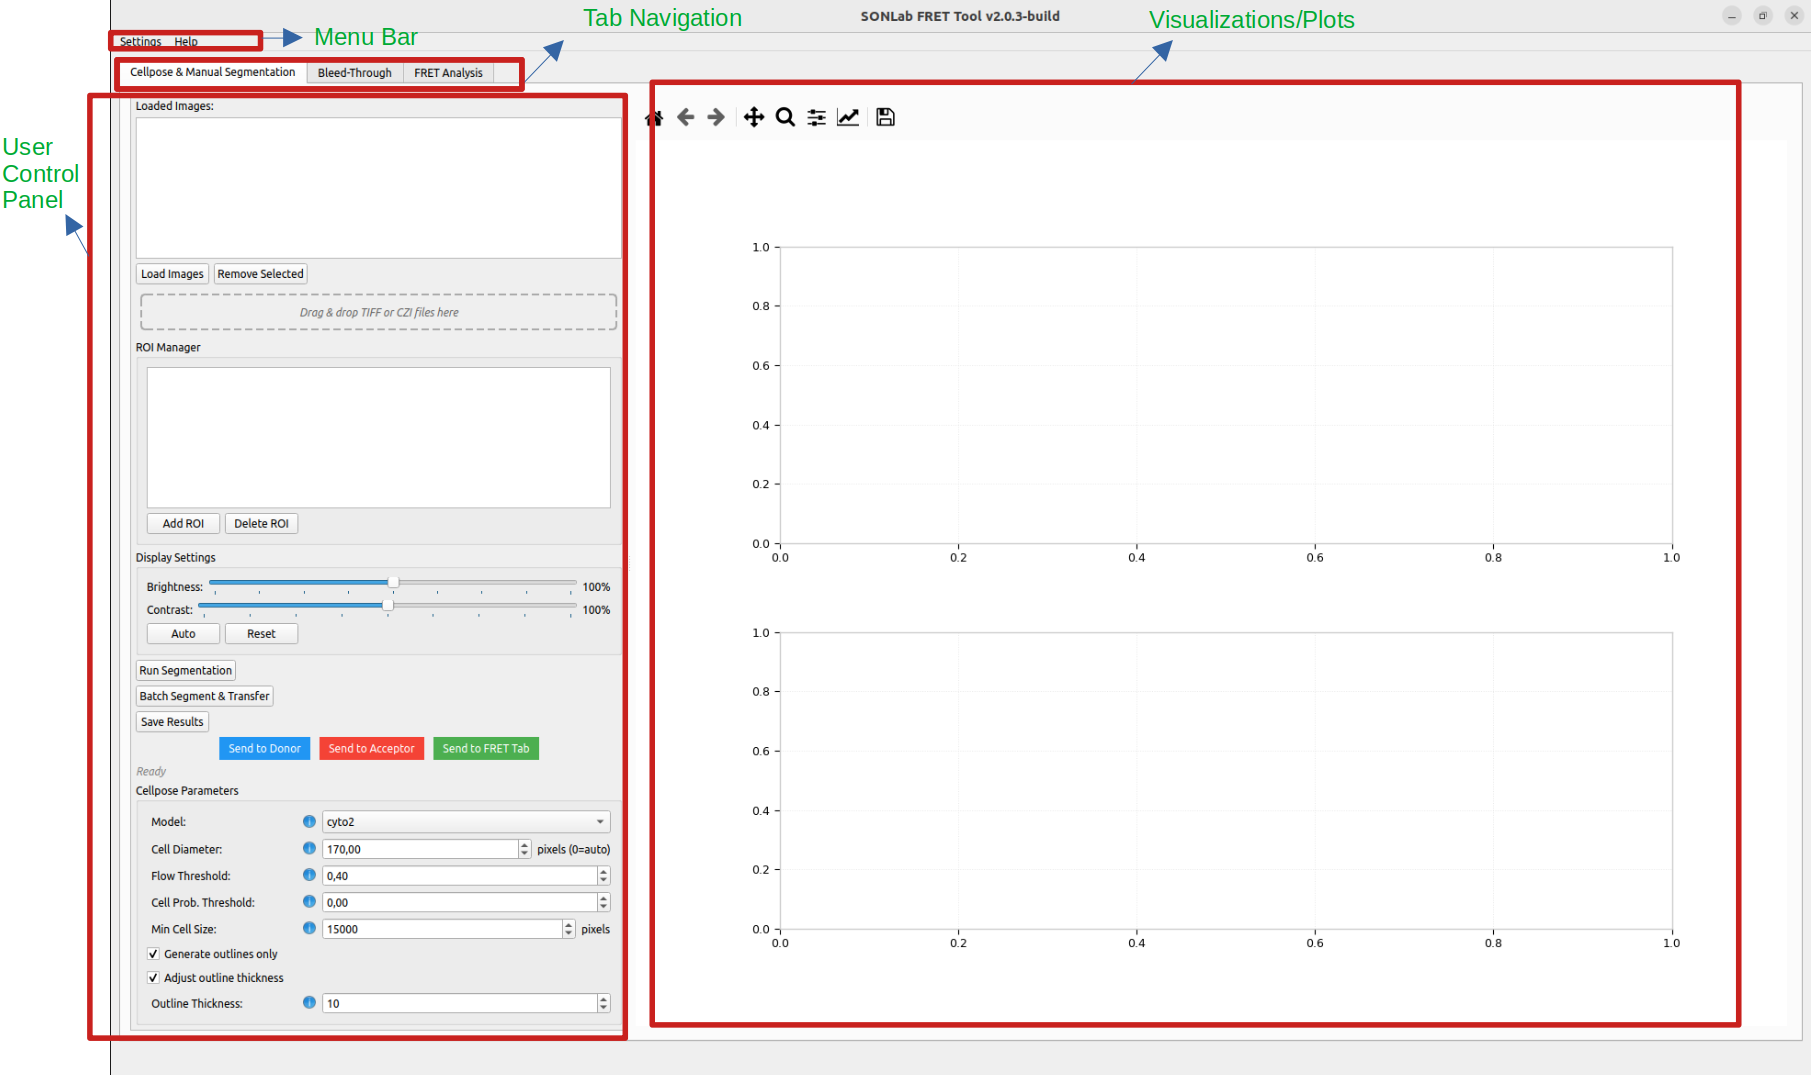 The four regions of the interface: the menu bar, the tab navigation, the left-hand user control panel, and the visualization/plots area.
The window is divided into three regions:
- Menu bar (top) — application settings and help.
-
Tab strip — switches between the analysis modules:
- Cellpose & Manual Segmentation
- Bleed-Through
- FRET Analysis
- Intensity / Densitometry
- Working area — the controls and visualizations for the active tab. Most tabs use a left-hand control panel and a central/-right visualization area.
The window title shows the application name and version (for example, SONLab FRET Tool v2.1.0-build).
| Item | Description |
|---|---|
| Font Size ▸ slider | Adjusts the application-wide font size live with a slider. |
| Font Size ▸ Reset | Restores the default font size. |
| Theme ▸ Light / Dark | Switches between the light and dark color themes. |
| Theme ▸ Dark Theme Editor | Opens a dialog to customize the dark theme colors. |
| Compact Layout | Toggles a denser layout that reduces padding/margins — useful on smaller screens. |
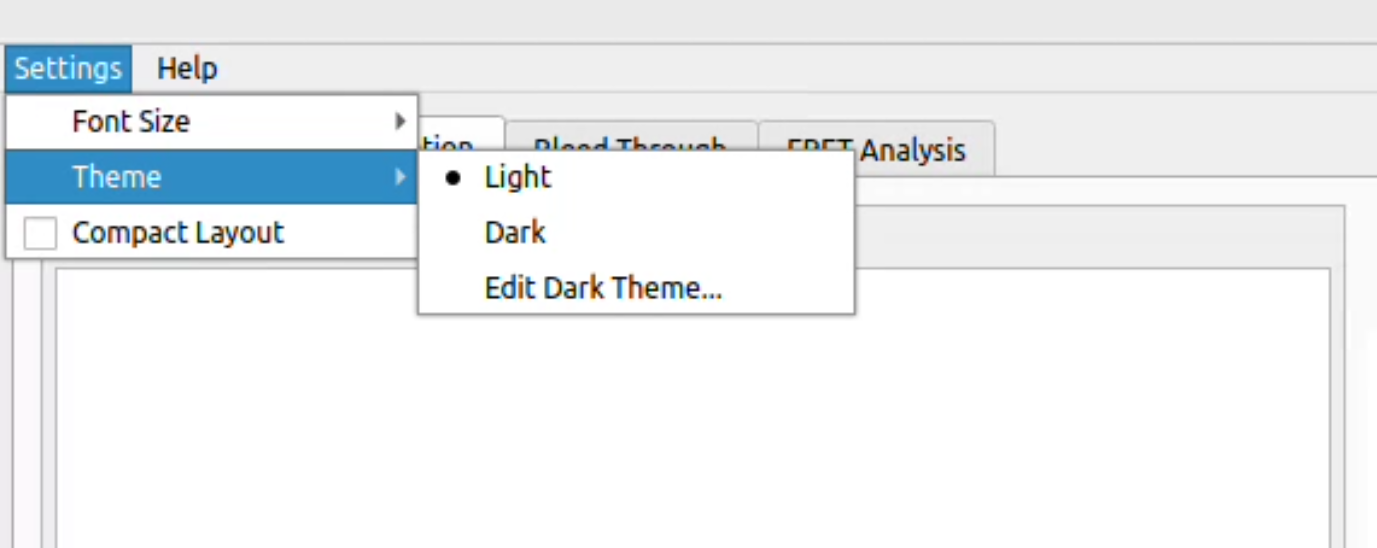 The Settings menu, with the Theme submenu (Light, Dark, Edit Dark Theme…) open.
Edit Dark Theme… opens a color editor for customizing the dark palette. The dark theme applies to the whole application:
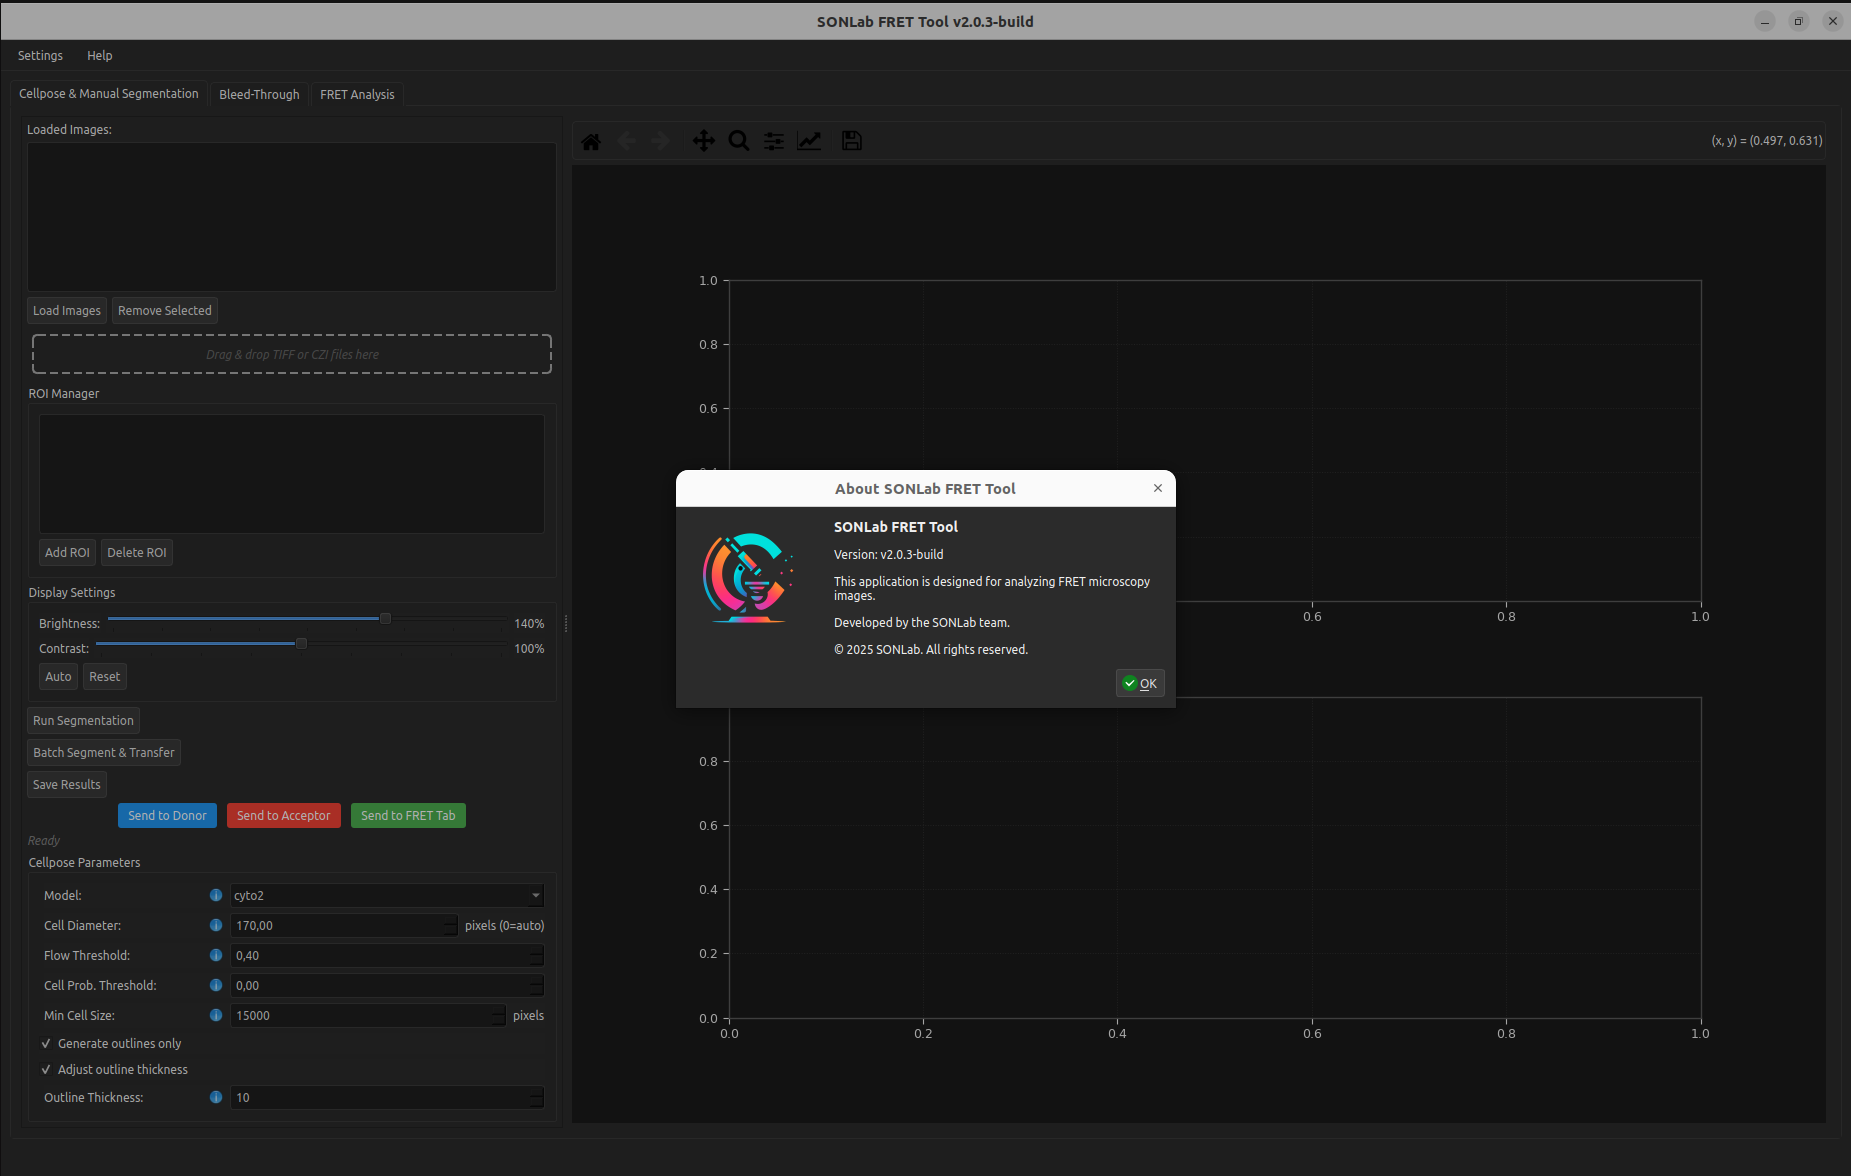 The application in dark theme. The About dialog (Help ▸ About) shows the version and license information.
| Item | Description |
|---|---|
| Walk-through | Opens a guided walkthrough with one page per pipeline stage: Welcome, Segmentation, Bleed-Through, and FRET Analysis. Available any time, even after dismissing it on startup. |
| User Guide | Opens this user guide. |
| About | Shows version, authorship, and license information. |
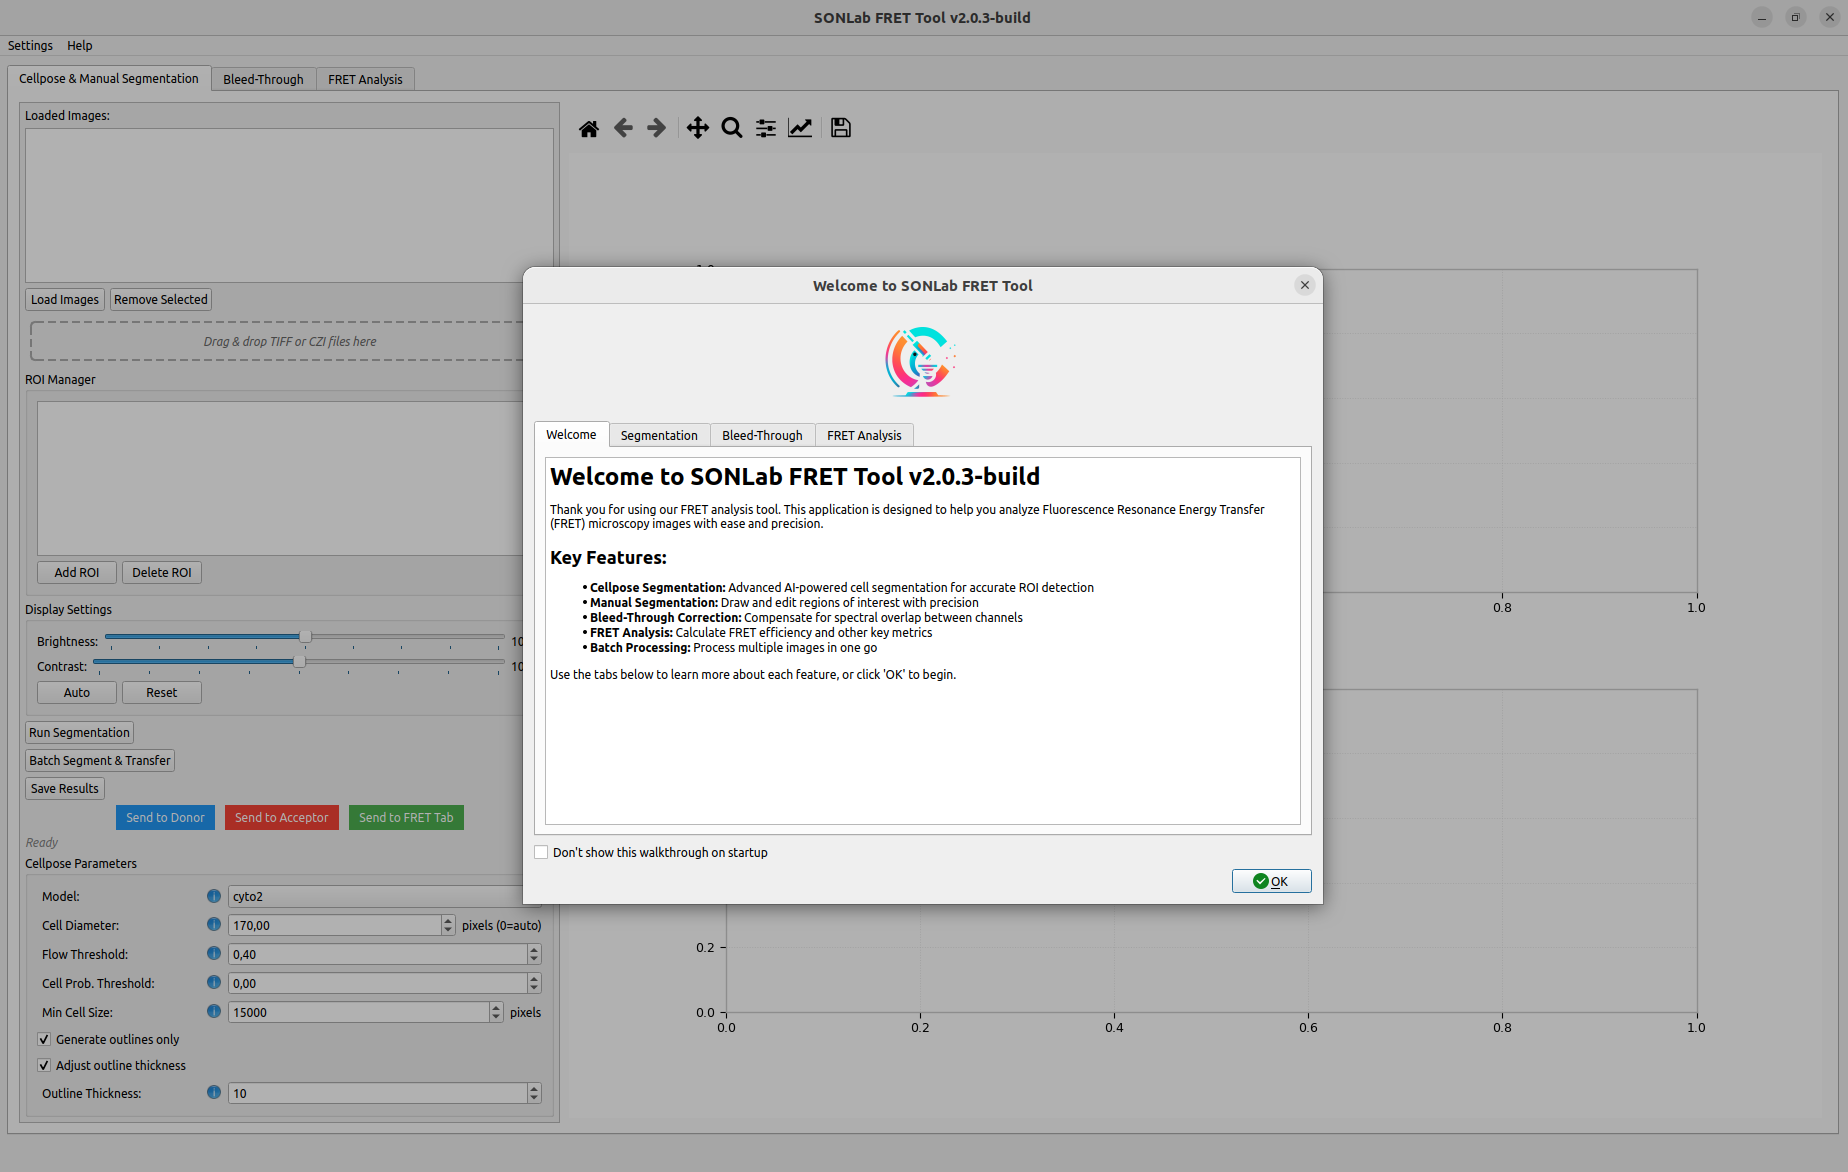 The Help ▸ Walk-through dialog. Each tab introduces one stage of the pipeline; tick "Don't show… on startup" to skip it next launch.
- ⓘ Info icons sit next to many controls. Hover over them to read a one-line description of what the control does.
-
Drag & drop is supported on image lists — drop
.tif,.tiff, or.czifiles directly onto a tab to add them. - Mouse wheel does not change the value of dropdowns or spin boxes anywhere in the app; this prevents accidental edits while scrolling. Click a field and type, or use the up/down arrows.
- Pop-out buttons open a plot in a larger, separate window with its own toolbar and a 300 DPI Save button for publication-quality figures. Legends are opened in their own Legend window so they never crowd the plot.
- Matplotlib toolbars under plots provide zoom, pan, and save controls.
- Metadata buttons (on the image lists) show the acquisition metadata (TIFF tags / CZI metadata) of the selected image.
- New to the tool? Start with Segmentation and follow the pipeline left to right.
- Want the big picture first? Read Workflows and Data Flow.