FRET Analysis
The FRET Analysis tab computes pixel-wise FRET efficiency from segmented, bleed-through-corrected images, organizes images into experimental groups, and produces statistics and figures. This page covers loading data and configuring/running the analysis; the outputs are described in Results and Visualization.
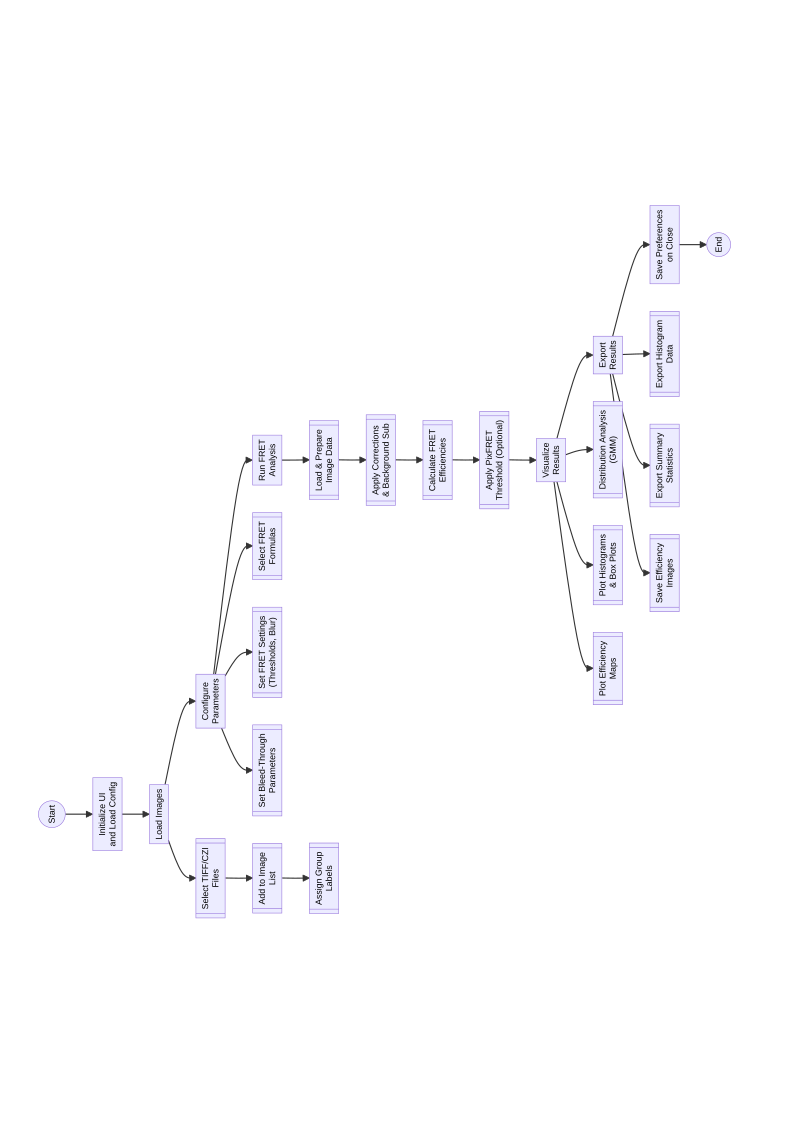
Flow of the FRET stage, from loading segmented images to exporting results.
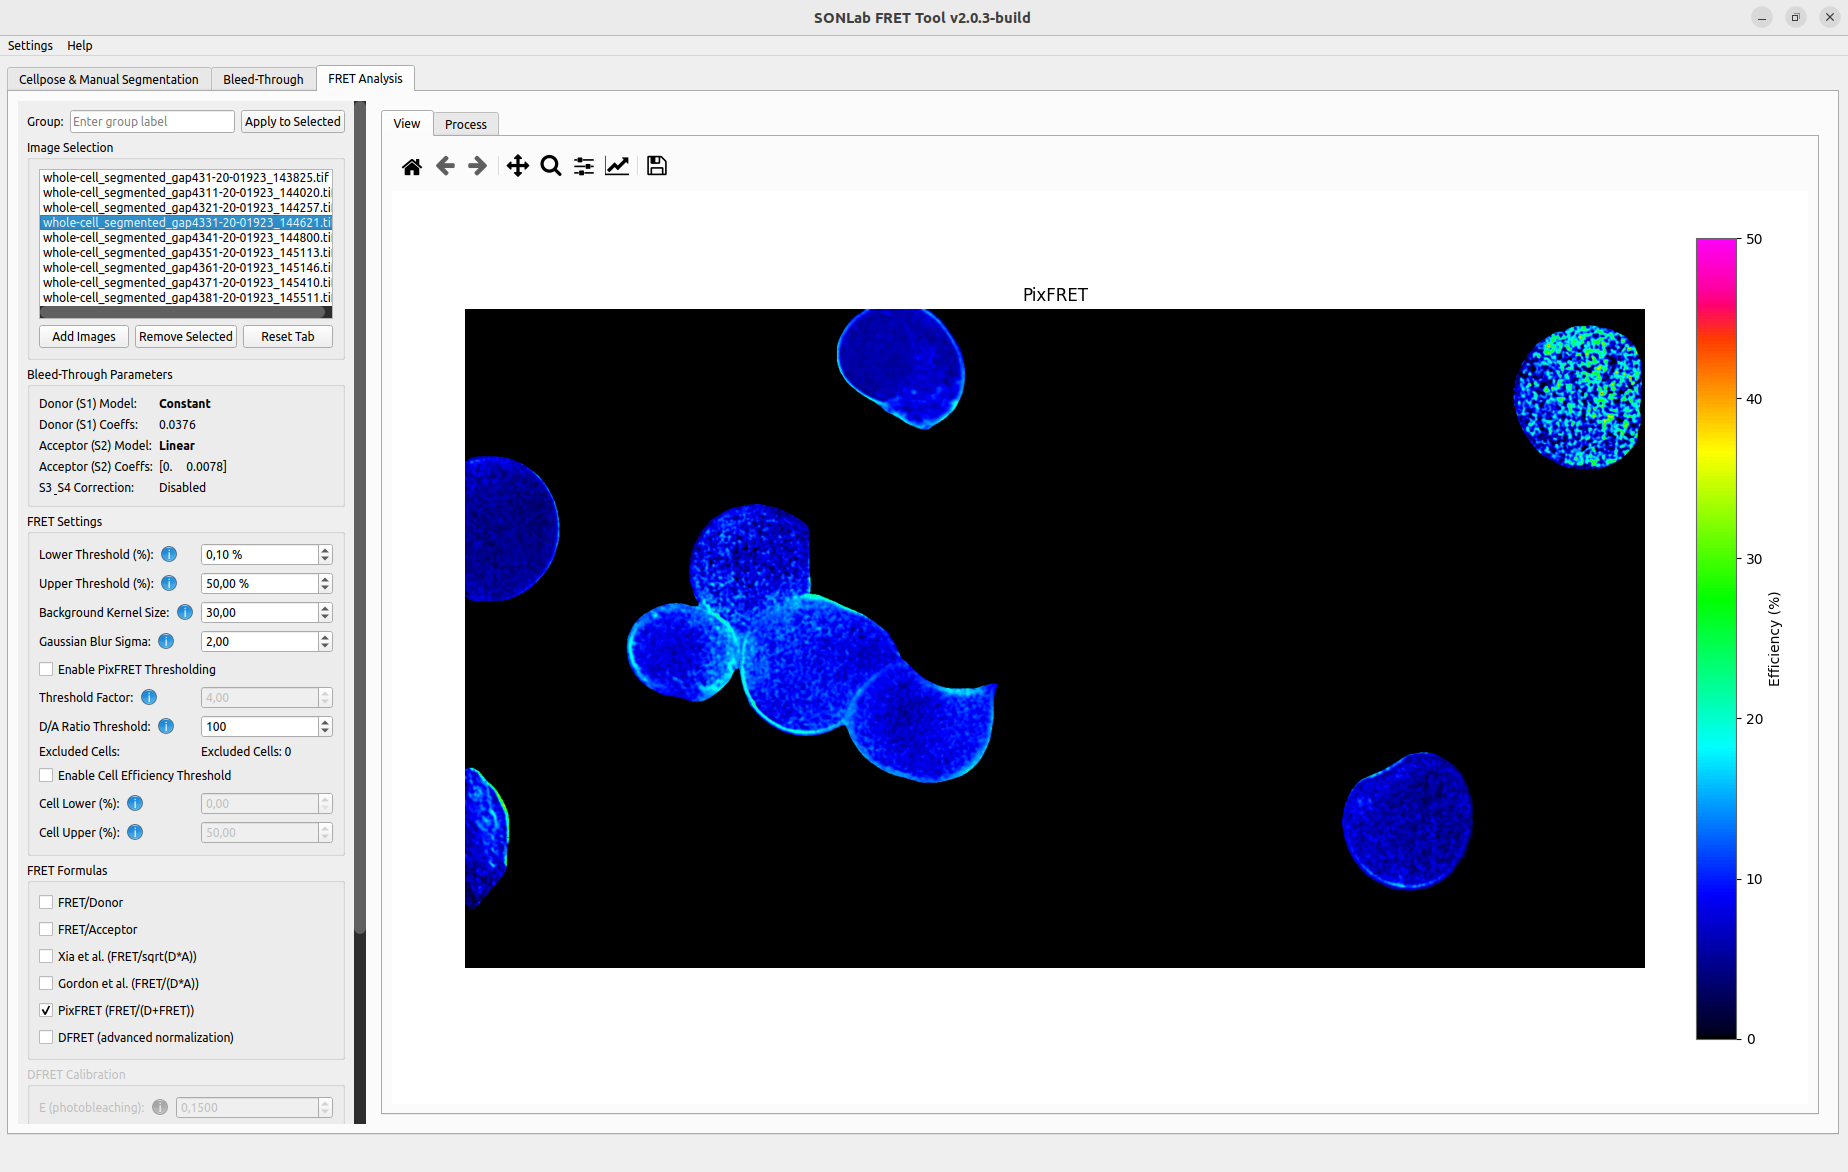 The FRET Analysis tab: image list/grouping, the bleed-through parameters, FRET settings, and formula selection on the left; a color-coded efficiency map on the right.
- Add segmented images (from the Segmentation tab or disk).
- Confirm the bleed-through parameters carried over from the Bleed-Through Correction tab.
- Set the FRET thresholds and any optional filters.
- Select one or more FRET formulas.
- (Optional) Calibrate DFRET.
- Assign groups for comparison.
- Run the analysis and review the results.
The Image Selection panel manages the images to analyze.
-
Add Images — load one or more segmented
.tif/.tiff(or.czi) stacks. - Remove Selected — remove images from the list. When the list empties, every plot and table is cleared.
- Reset Tab — clear all images, results, and displays and start fresh.
- Group assignment — choose a group name and click Apply to Selected to tag the highlighted images. Groups drive the comparative statistics (e.g. control vs. treatment) across the rest of the tab.
Images sent from the segmentation tab via Send to FRET or Batch Segment && Transfer arrive here automatically, optionally pre-tagged with a group.
The Bleed-Through Parameters panel shows the correction model currently in effect:
- Donor model / coefficients
- Acceptor model / coefficients
- S3 / S4 status (Enabled or Disabled)
These are populated from the confirmed fits in the Bleed-Through Correction tab (or from a loaded bt_params.json). They are applied automatically when the analysis runs. If they read N/A, return to the Bleed-Through tab, confirm the fits, and save the parameters.
| Setting | Default | Description |
|---|---|---|
| Lower Threshold (%) | 0 |
Minimum efficiency shown on the maps. |
| Upper Threshold (%) | 50 |
Maximum efficiency shown on the maps (values above are clamped in the display). |
| Background Kernel Size | 30 |
Kernel size for local background subtraction. |
| Gaussian Blur Sigma | 2.0 |
Sigma for an optional Gaussian blur; set to 0 to disable. |
The display thresholds affect the visualized maps. The statistics tables report both a true non-zero average (over all non-zero pixels) and a separate thresholded average — see Results and Visualization.
Enable Enable PixFRET Thresholding to apply an intensity-based mask using:
-
Threshold Factor (default
1.0) — multiplier for the PixFRET threshold calculation, together with the background kernel and Gaussian sigma above.
Enable Enable Cell Efficiency Threshold to exclude whole cells whose mean efficiency falls outside a range:
- Cell Lower (%) — exclude cells with a mean efficiency below this value.
- Cell Upper (%) — exclude cells with a mean efficiency above this value.
This removes outlier cells (e.g. saturated or non-expressing) from the aggregate statistics.
Select one or more formulas in the FRET Formulas panel; each selected formula produces its own efficiency map and statistics. Here F, D, and A are the corrected FRET, Donor, and Acceptor intensities.
| Formula | Expression | Notes |
|---|---|---|
| FRET/Donor | F / D |
Basic donor-normalized ratio. |
| FRET/Acceptor | F / A |
Acceptor-normalized ratio. |
| Xia et al. | F / √(D·A) |
Accounts for both donor and acceptor contributions. |
| Gordon et al. | F / (D·A) |
Alternative dual normalization. |
| PixFRET | F / (D + F) |
Common for sensitized-emission FRET. |
| DFRET | advanced normalization | Calibrated, photobleaching-anchored efficiency (see below). |
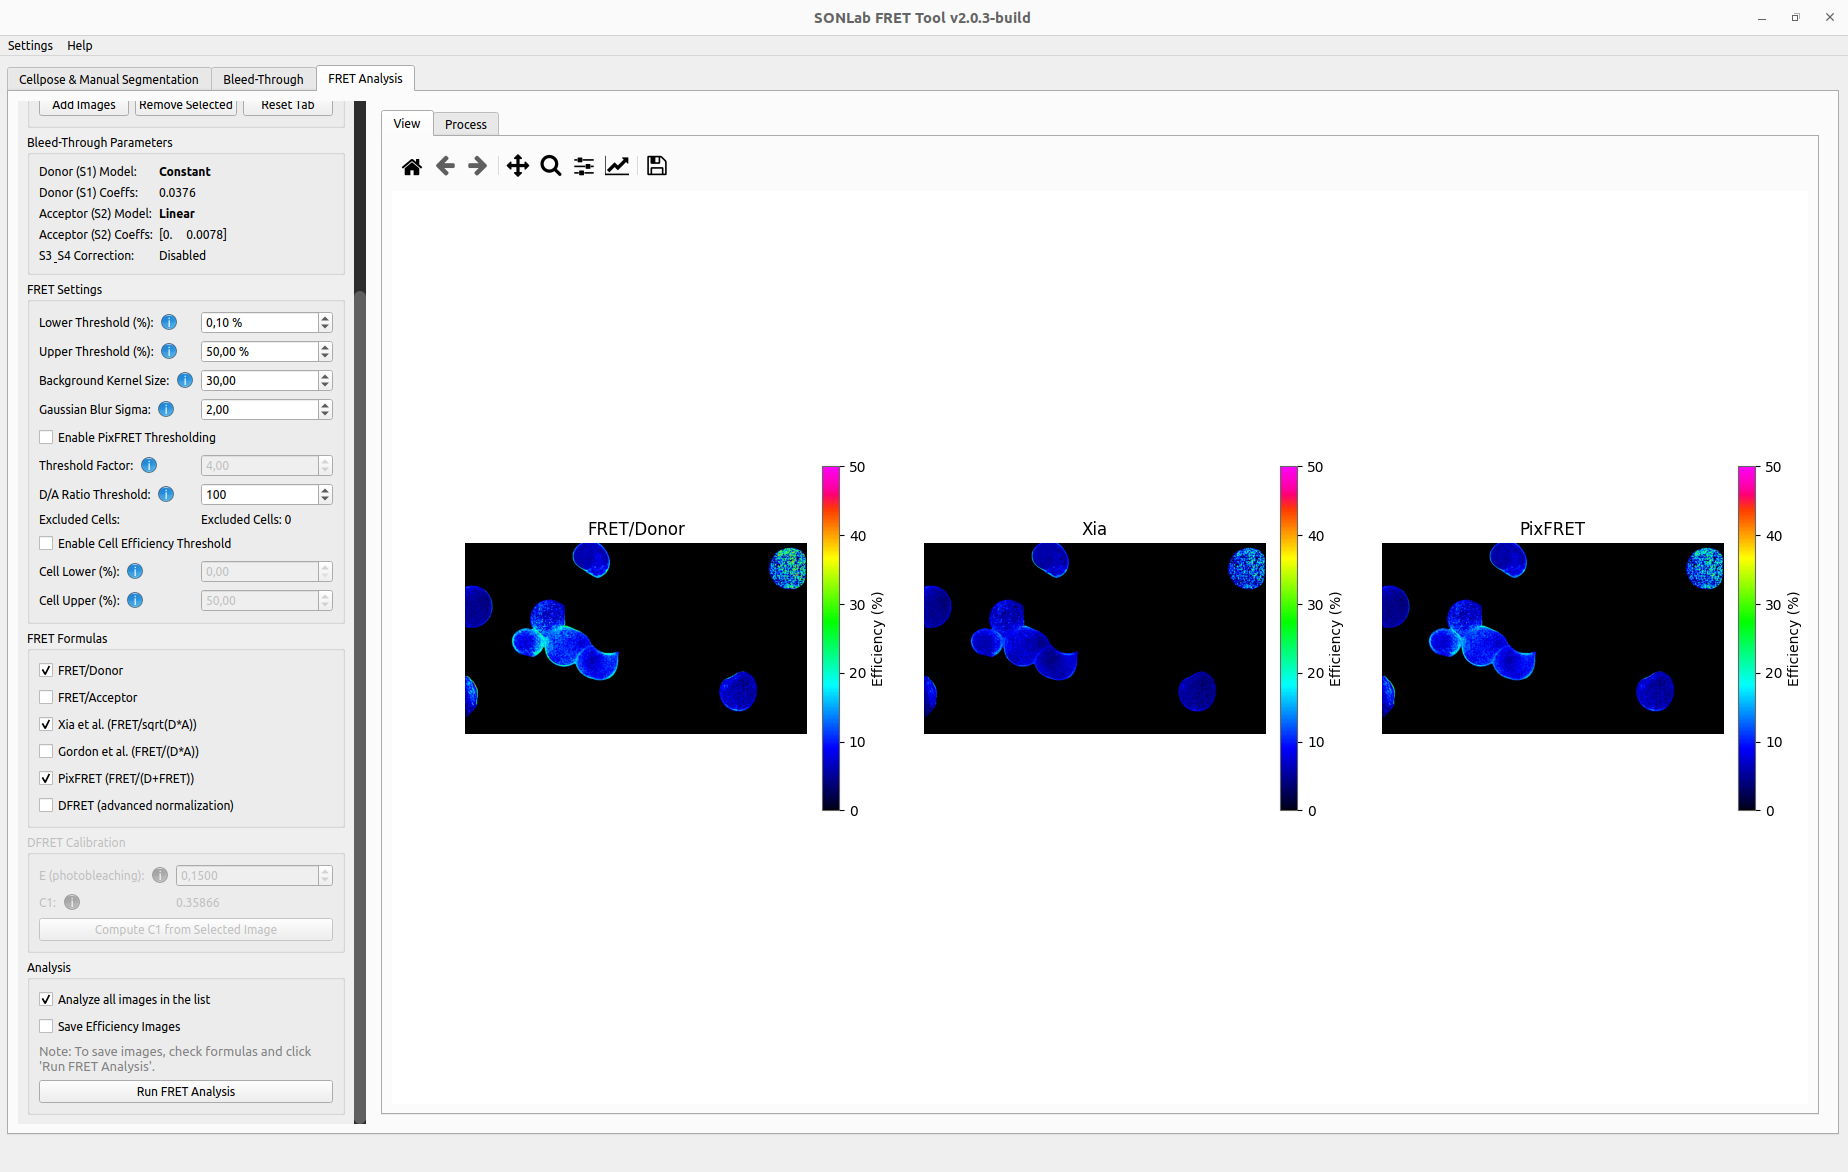 Multiple formulas can be computed at once; each selected formula (here FRET/Donor, Xia, and PixFRET) produces its own efficiency map for side-by-side comparison.
DFRET applies an advanced normalization (after Hochreiter et al.) that anchors efficiency to a photobleaching measurement. Configure it in the DFRET Calibration panel:
- E (photobleaching) — the FRET efficiency (0–1) determined from a donor–acceptor fusion construct by photobleaching. Required when DFRET is enabled.
- C1 — the donor normalization factor (Eq. 6 in Hochreiter et al.).
-
Compute C1 from Selected Image — derives
C1automatically from the currently selected fusion-construct image, given a validE.
DFRET requires a positive
Evalue to proceed. If it is missing, the tool prompts you to enter one.
In the Analysis panel:
- Analyze all images in the list — when checked, every loaded image is processed; otherwise only the selected image is analyzed.
- Run FRET Analysis — executes the calculation with the current settings, applying the bleed-through correction and producing efficiency maps, statistics, and plots.
After the run, explore the outputs as described in Results and Visualization.
| Symptom | Try this |
|---|---|
| BT parameters show N/A | Confirm and save the fits in the Bleed-Through tab. |
| DFRET refuses to run | Enter a positive E value, or compute C1 from a fusion image. |
| Maps look empty | Check the Lower/Upper thresholds and that the images contain a segmentation mask (frame 0). |
| All cells excluded | Loosen the Cell Efficiency Threshold range or disable it. |
| Unexpected efficiency values | Verify the channel order of the input stack (mask, FRET, Donor, Acceptor) — see File Formats. |