Debugger
Debug your utPLSQL tests directly in VSCode's native Debug Adapter, using
Oracle's DBMS_DEBUG.
Introduced in PRD-33; the client was rewritten against the real
DBMS_DEBUGAPI in PRD-71 (0.12.1).
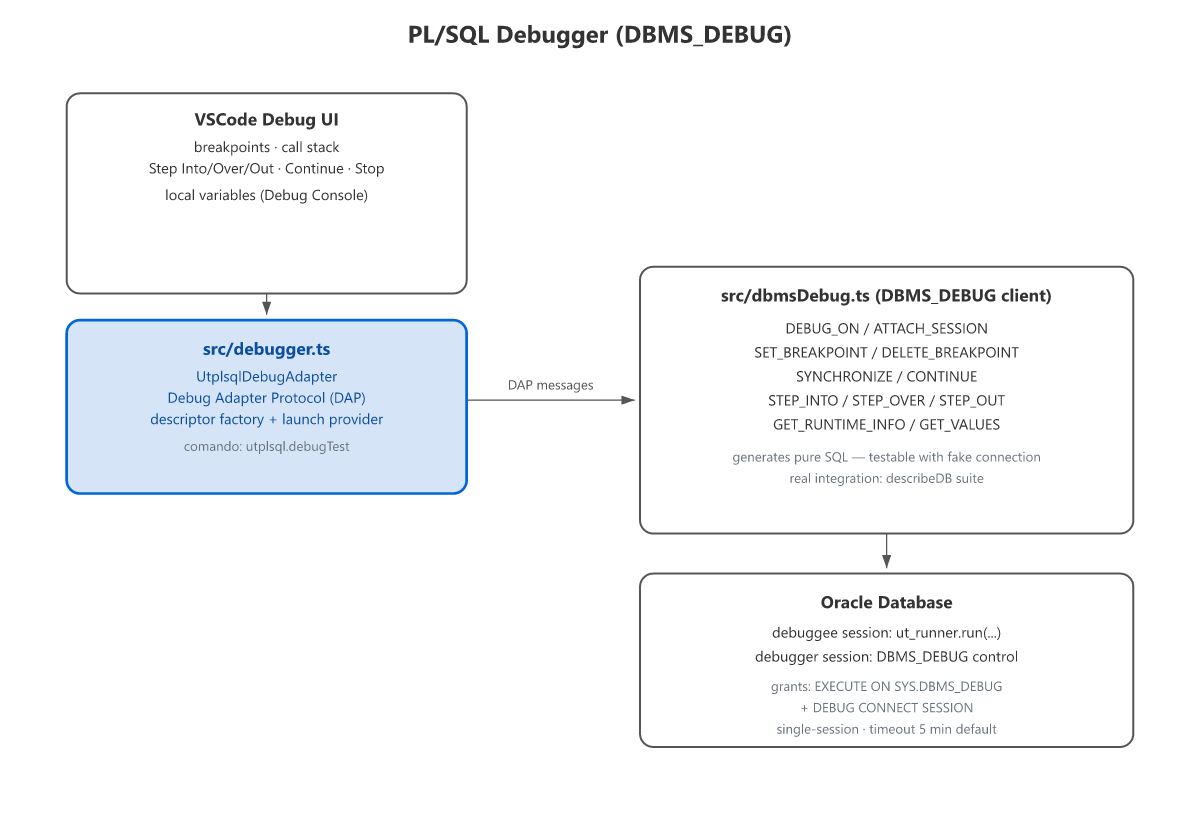
The debugger uses two Oracle sessions:
debuggee session  ──► ut_runner.run(a_paths => pkg[.proc])   (runs the test)
debugger session  ──► DBMS_DEBUG: INITIALIZE / DEBUG_ON,
                      ATTACH_SESSION, SET_BREAKPOINT, CONTINUE, GET_VALUE
The debuggee enables debugging (DEBUG_ON) and runs the test. The debugger
session attaches to the target session id, sets breakpoints and drives execution
(CONTINUE + breakflags). The VSCode adapter (utplsql) translates the DAP
protocol into those calls.
There are no
STEP_INTO/STEP_OVER/STEP_OUTorGET_VALUESinDBMS_DEBUG. Stepping isCONTINUEwithbreakflags; variables are read one by one withGET_VALUE(name).
Breakpoints are registered in the DBMS_DEBUG namespace that matches the file
type — namespace_pkgspec_or_toplevel for standalone procedures/functions,
namespace_pkg_body for package bodies, namespace_trigger for triggers — and
the file line is aligned to the stored object source when the file has a comment
header before the CREATE statement.
-
Command palette:
utPLSQL: Debug test (PL/SQL)(utplsql.debugTest) — debugs the test/suite under the active.pks. -
Editor context menu: the same command is offered when right-clicking a
.pks/.pkbfile. -
Run and Debug: choose utPLSQL Debugger when creating a
launch.json; the generated configuration usespackageName: "${fileBasenameNoExtension}".
Breakpoints can be placed in .pks/.pkb/.prc/.fnc/.trg because the
extension contributes a plsql language and the matching breakpoints
contribution (otherwise VSCode disables the gutter on files without a language
id). Breakpoints are only applied after the target reaches the entry — the
DBMS_DEBUG silently ignores "deferred" breakpoints. While the session is not
there yet, breakpoints are queued and installed on entry.
configurationDone does not auto-continue: when the session is ready it
emits stopped(reason=entry) and waits for your Continue/Step — so you can
inspect the call stack and variables before the test starts.
The utplsql debugger type is declared with these launch attributes:
| Attribute | Required | Description |
|---|---|---|
packageName |
Yes | Test package to debug |
testName |
No | Specific test procedure |
connection |
No | Oracle connection string (resolved from profile/setting if omitted) |
stopOnException |
No | Pause on unhandled exceptions (default from utplsql.debugger.stopOnException) |
The target object must be compiled with debug information for breakpoints to
hit. Instead of running the ALTER manually, use utPLSQL: Compile for Debug (utplsql.compileForDebug):
- Command palette, editor context menu (
.pks/.pkb/.fnc/.prc/.trg/.sql) and Explorer context menu (file or folder). - It derives the Oracle object from the file (
.pks/.pkb→ package,.fnc→ function,.prc→ procedure,.trg→ trigger;.sqlis tried as package → procedure → function → trigger). - The owner is the schema extracted from the path in
schemamode, otherwise the connection user. - It runs
ALTER <TYPE> "OWNER"."NAME" COMPILE DEBUG PLSQL_OPTIMIZE_LEVEL = 1on the active connection/profile (reusing the runner pool) and reports the result.COMPILE DEBUGalone only setsPLSQL_DEBUGand keeps the optimizer level (default 2), which can remove/reorder lines and make breakpoints miss.
To automate it, set utplsql.debugger.compileOnDebug to true: the extension
then compiles the package with debug info before starting the debug session.
-
utplsql.debugger.enabled=true(default). - Target package compiled with debug information
(
PLSQL_OPTIMIZE_LEVEL <= 1, orALTER PACKAGE ... COMPILE DEBUG PLSQL_OPTIMIZE_LEVEL = 1). - Grants:
GRANT DEBUG CONNECT SESSIONandGRANT EXECUTE ON SYS.DBMS_DEBUG. See Database Requirements.
GRANT DEBUG CONNECT SESSION TO <schema>;
GRANT EXECUTE ON SYS.DBMS_DEBUG TO <schema>;
ALTER PACKAGE <schema>.<package> COMPILE DEBUG PLSQL_OPTIMIZE_LEVEL = 1;| Setting | Default | Description |
|---|---|---|
utplsql.debugger.enabled |
true |
Enables PL/SQL test debugging |
utplsql.debugger.stopOnException |
true |
Pauses when an unhandled exception is raised |
utplsql.debugger.timeoutSeconds |
300 |
Debug session timeout (terminates on expiry) |
- Breakpoints in
.pks/.pkb/.prc/.fnc/.trg(in the code under test — see Limitations for test packages) - Continue, Step Into, Step Over, Step Out
- The current frame in the Call Stack
- Local variables in the Variables pane
-
pauseis not supported (no asynchronous interrupt inDBMS_DEBUG). - Variables are read-only (no
setVariable). - A single frame is reported in the call stack.
- Breakpoints in the test package (
test_*.pkb) may not hit: utPLSQL runs tests through dynamic SQL, whichDBMS_DEBUGdoes not instrument. Put the breakpoints in the code under test (production function/procedure/package); those are hit normally throughut_runner.run. - The debugger uses dedicated connections (not the runner pool): the debuggee
stays blocked in
ut_runner.runwhile you debug, and sharing the pool would exhaust it (NJS-040 queueTimeout). It respects the client mode (utplsql.oracleClientMode).
If the session does not stop on a breakpoint:
- confirm the package was compiled with debug info;
- confirm the grants above;
- check the Debug Console for
[utplsql-debug]messages (attach/timeout errors).