Repository navigation
CLI_plot
Allows the user to create a variety of plots to visualize variable data.
nes plot -i <input_file.nc> -v <variable> -l <level> -t <time_step> -m <method> -c <colormap> --animation_method <animation_method> --save --scale <scale> --threshold <threshold> --percentile_clip LOWER UPPER-
-i,--input_file(required): Path to the input NetCDF file. -
-v,--variable(required): Name of the variable to plot, must match its format as it is found in the NetCDF. -
-l,--level: Vertical level index to plot - (default: 0). -
-t,--time_step: Time step index to plot - ignored whenmethodis animation (default: 0). -
-m,--method: Plotting method - either "colormesh", "contour", "surface", "histogram" or "animation" (default: colormesh). -
--animation_method: Plotting method to use to generate animation - either "contour" or "colormesh" (default: colormesh). -
-c,--cmap: Colormap to use for plotting, all Matplotlib colormaps are accepted - a list of available maps is available here (default: viridis) -
--save: Whether to save the plot or display it using Matplotlib's interactive viewer - ignored formethod"animation", as it is saved by default. -
--scale: Type of scale to apply to the data - either "linear", "log" or "power" (default: "linear") -
--threshold: Threshold value below which data is discarded (default: 0.0) -
--percentile_clip: Clip data to the specified percentiles (default: no explicit percentile clipping)
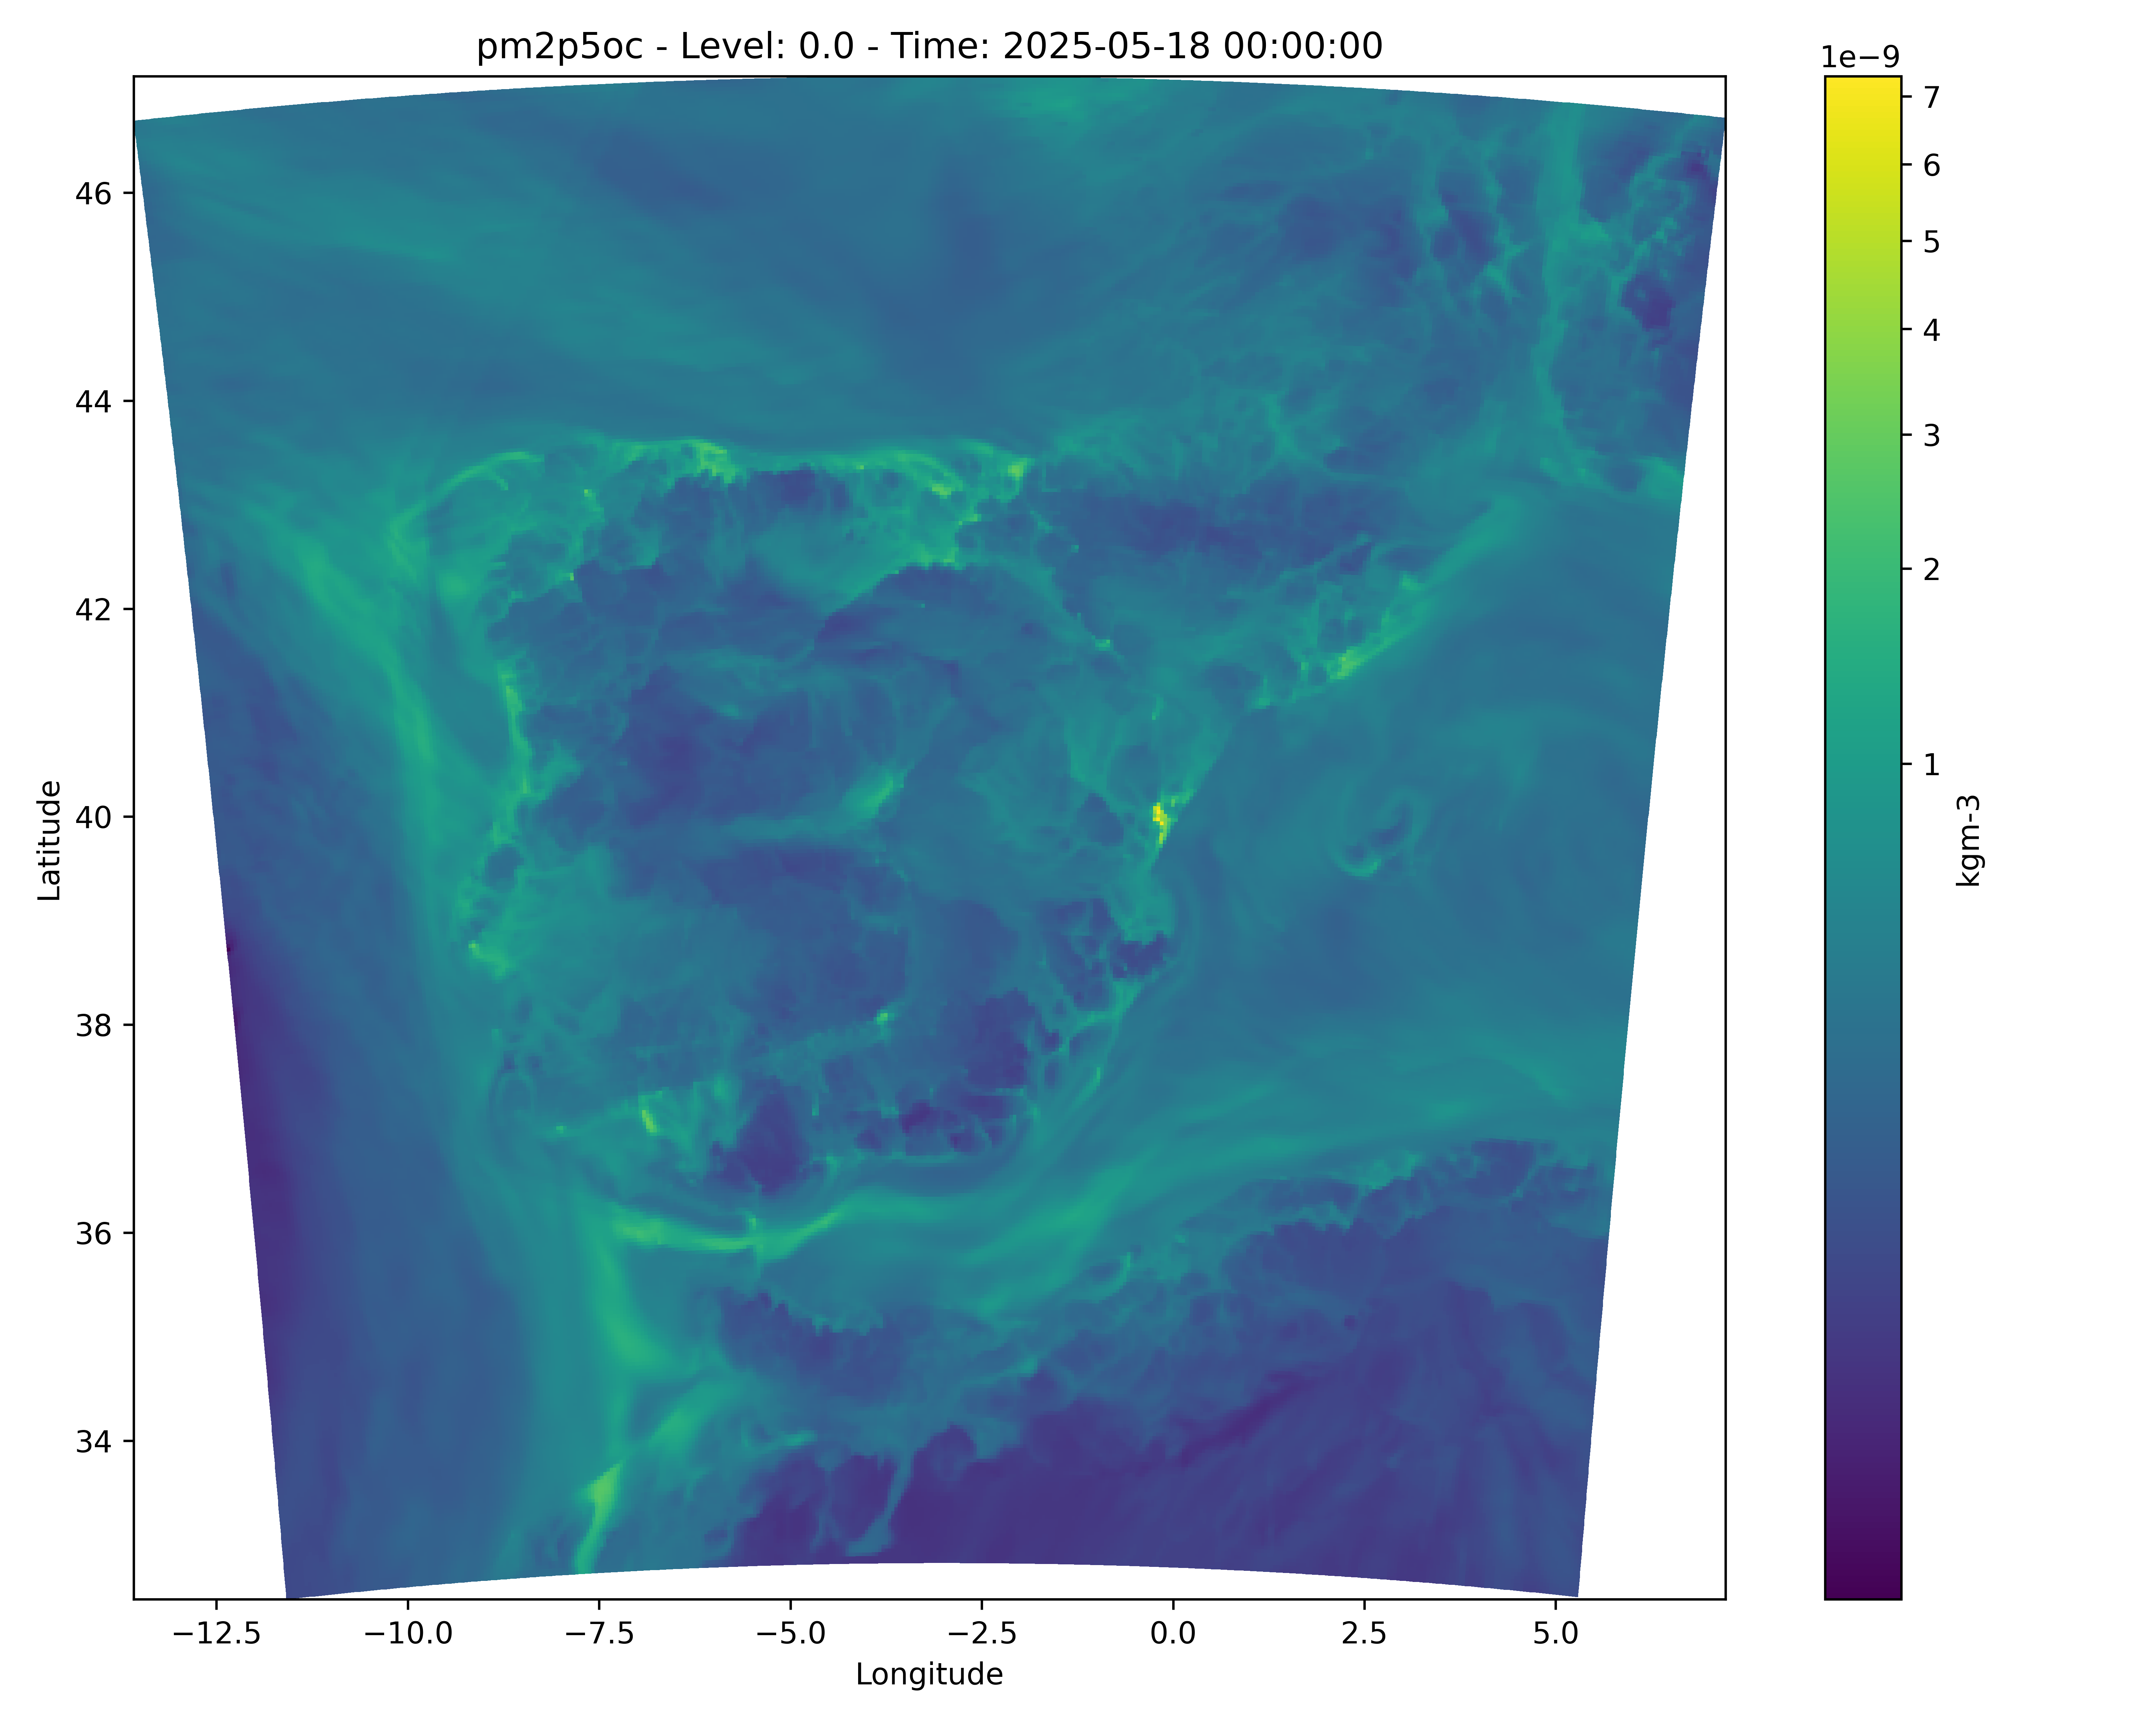
nes plot -i pm2p5oc_2025051800.nc -v pm2p5oc -l 0 -t 0 --method colormesh --scale power --cmap plasma --threshold 1e-12 --percentile_clip 5 95 --save
Pseudocolor plot with a non-regular rectangular grid.
nes plot -i pm2p5oc_2025051800.nc -v pm2p5oc --method colormesh
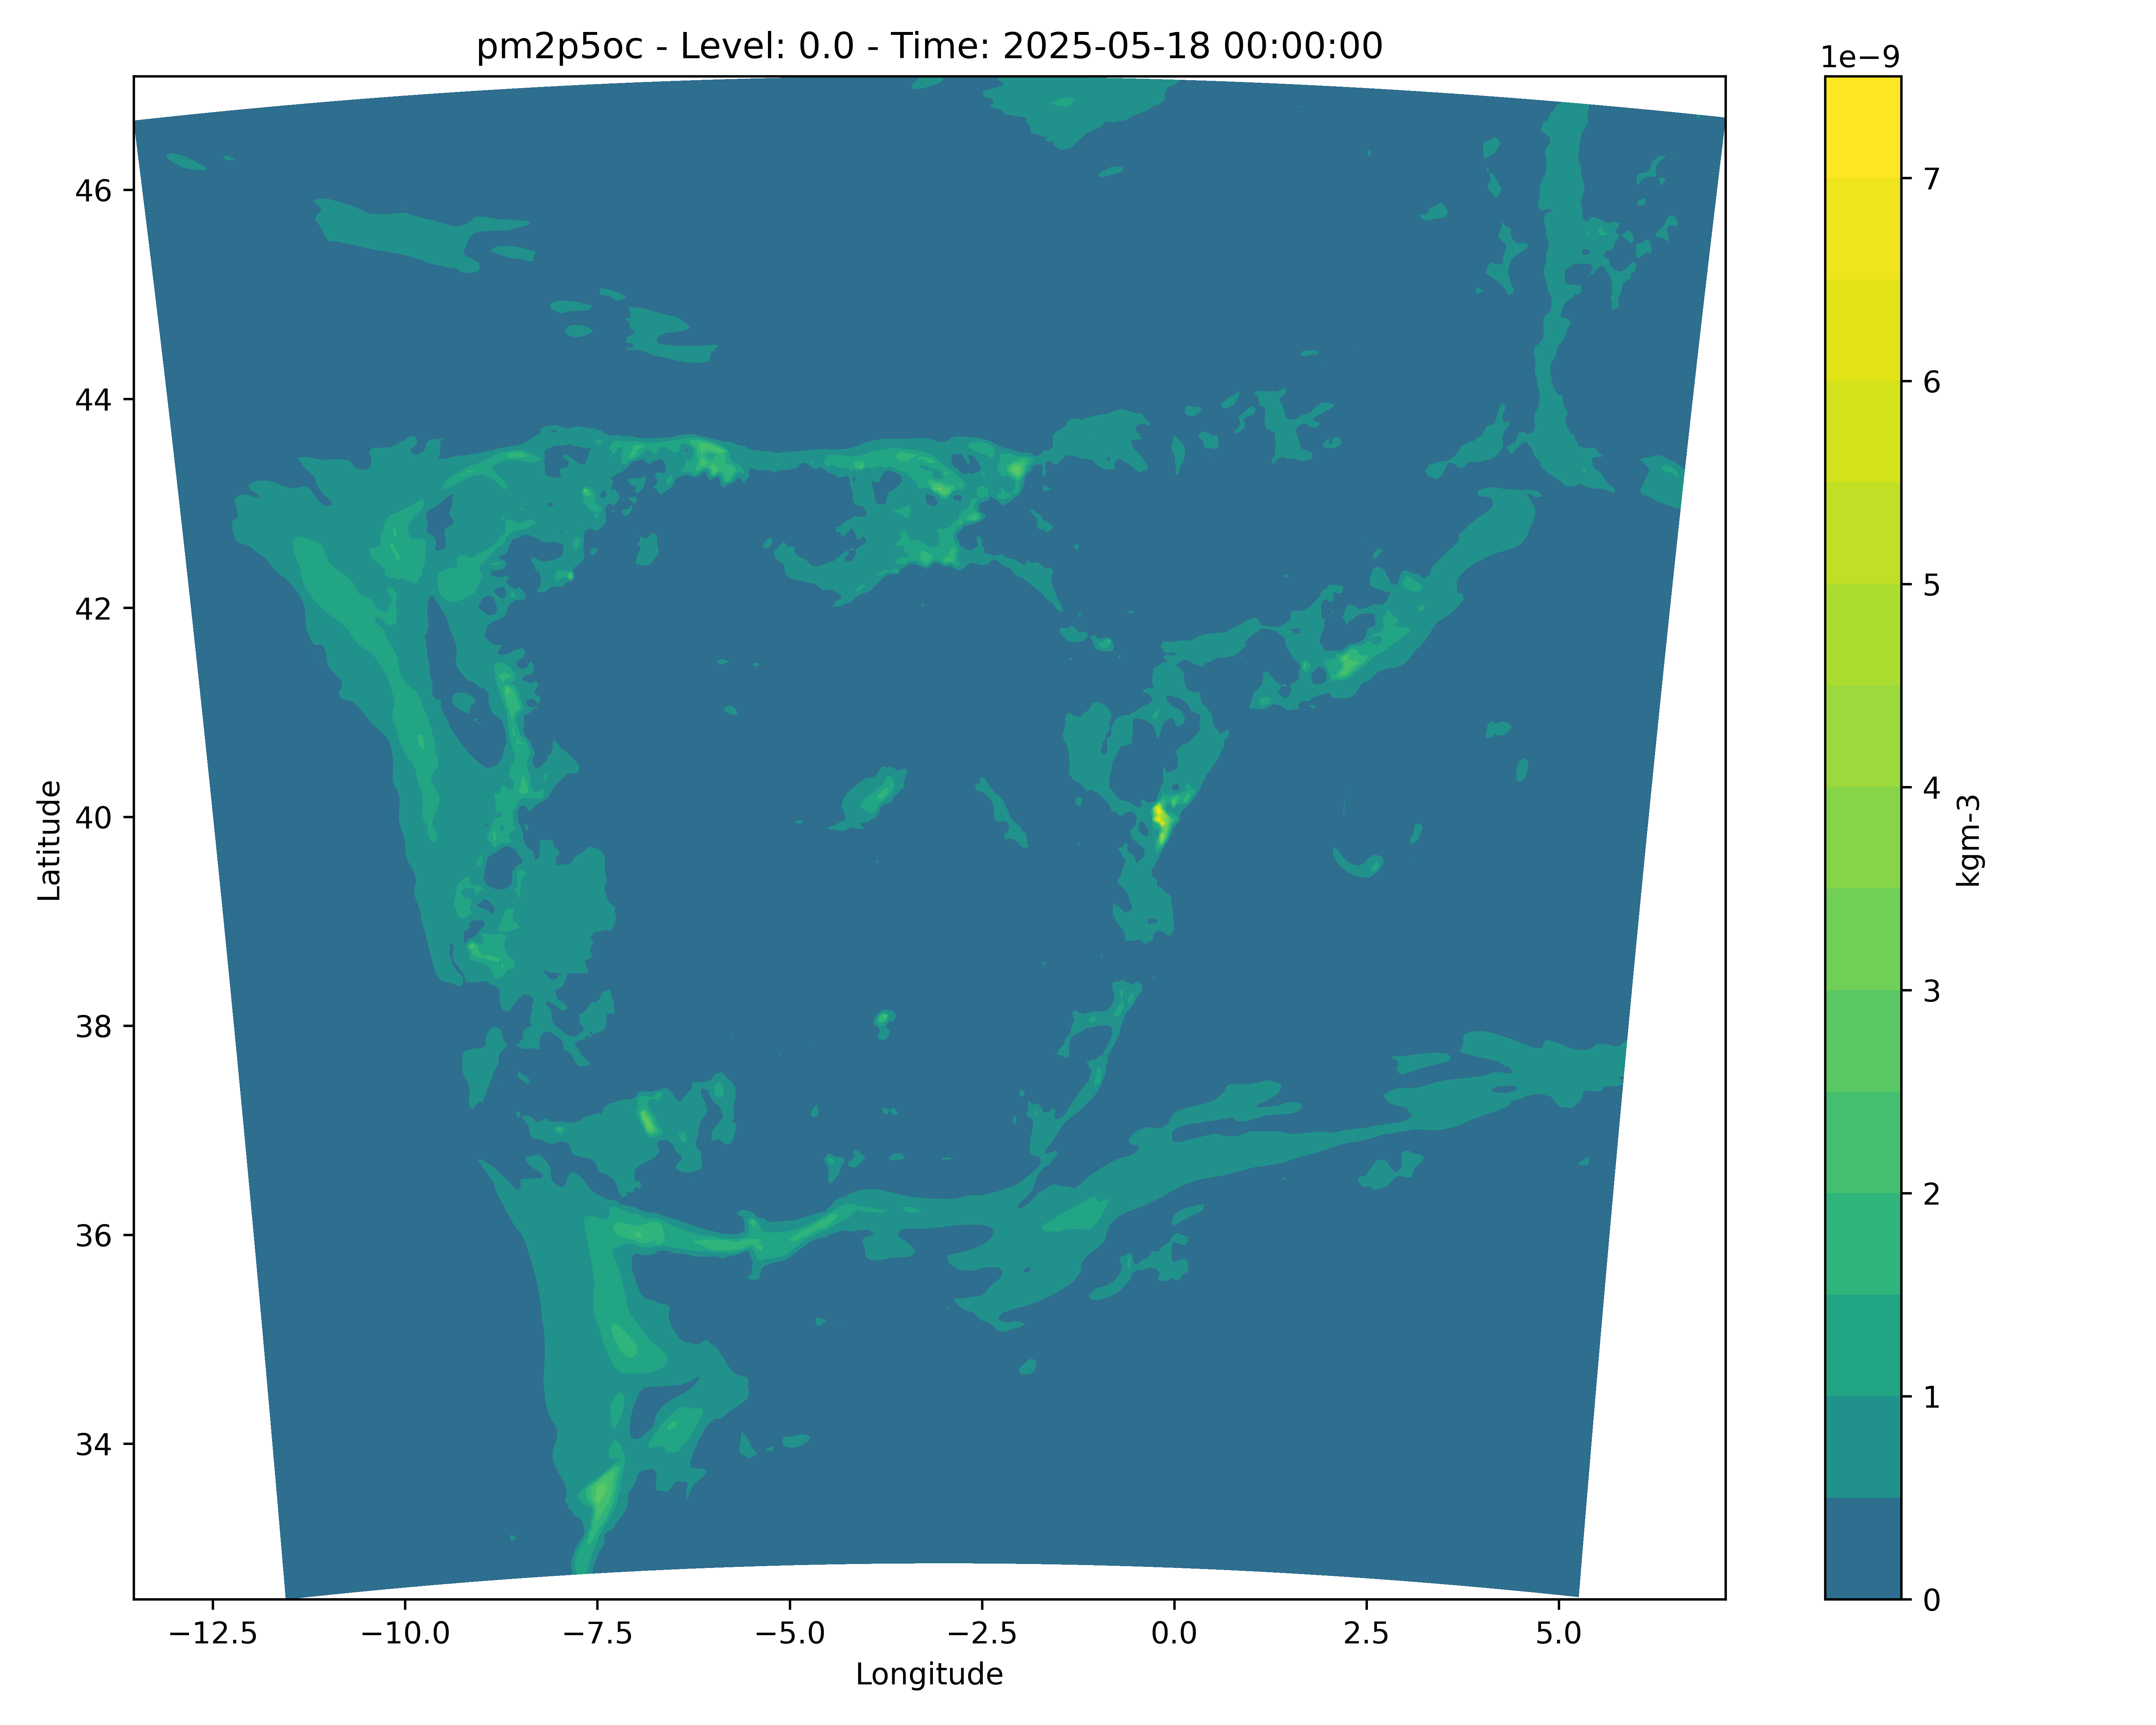
Filled contour plot.
nes plot -i pm2p5oc_2025051800.nc -v pm2p5oc --method contour
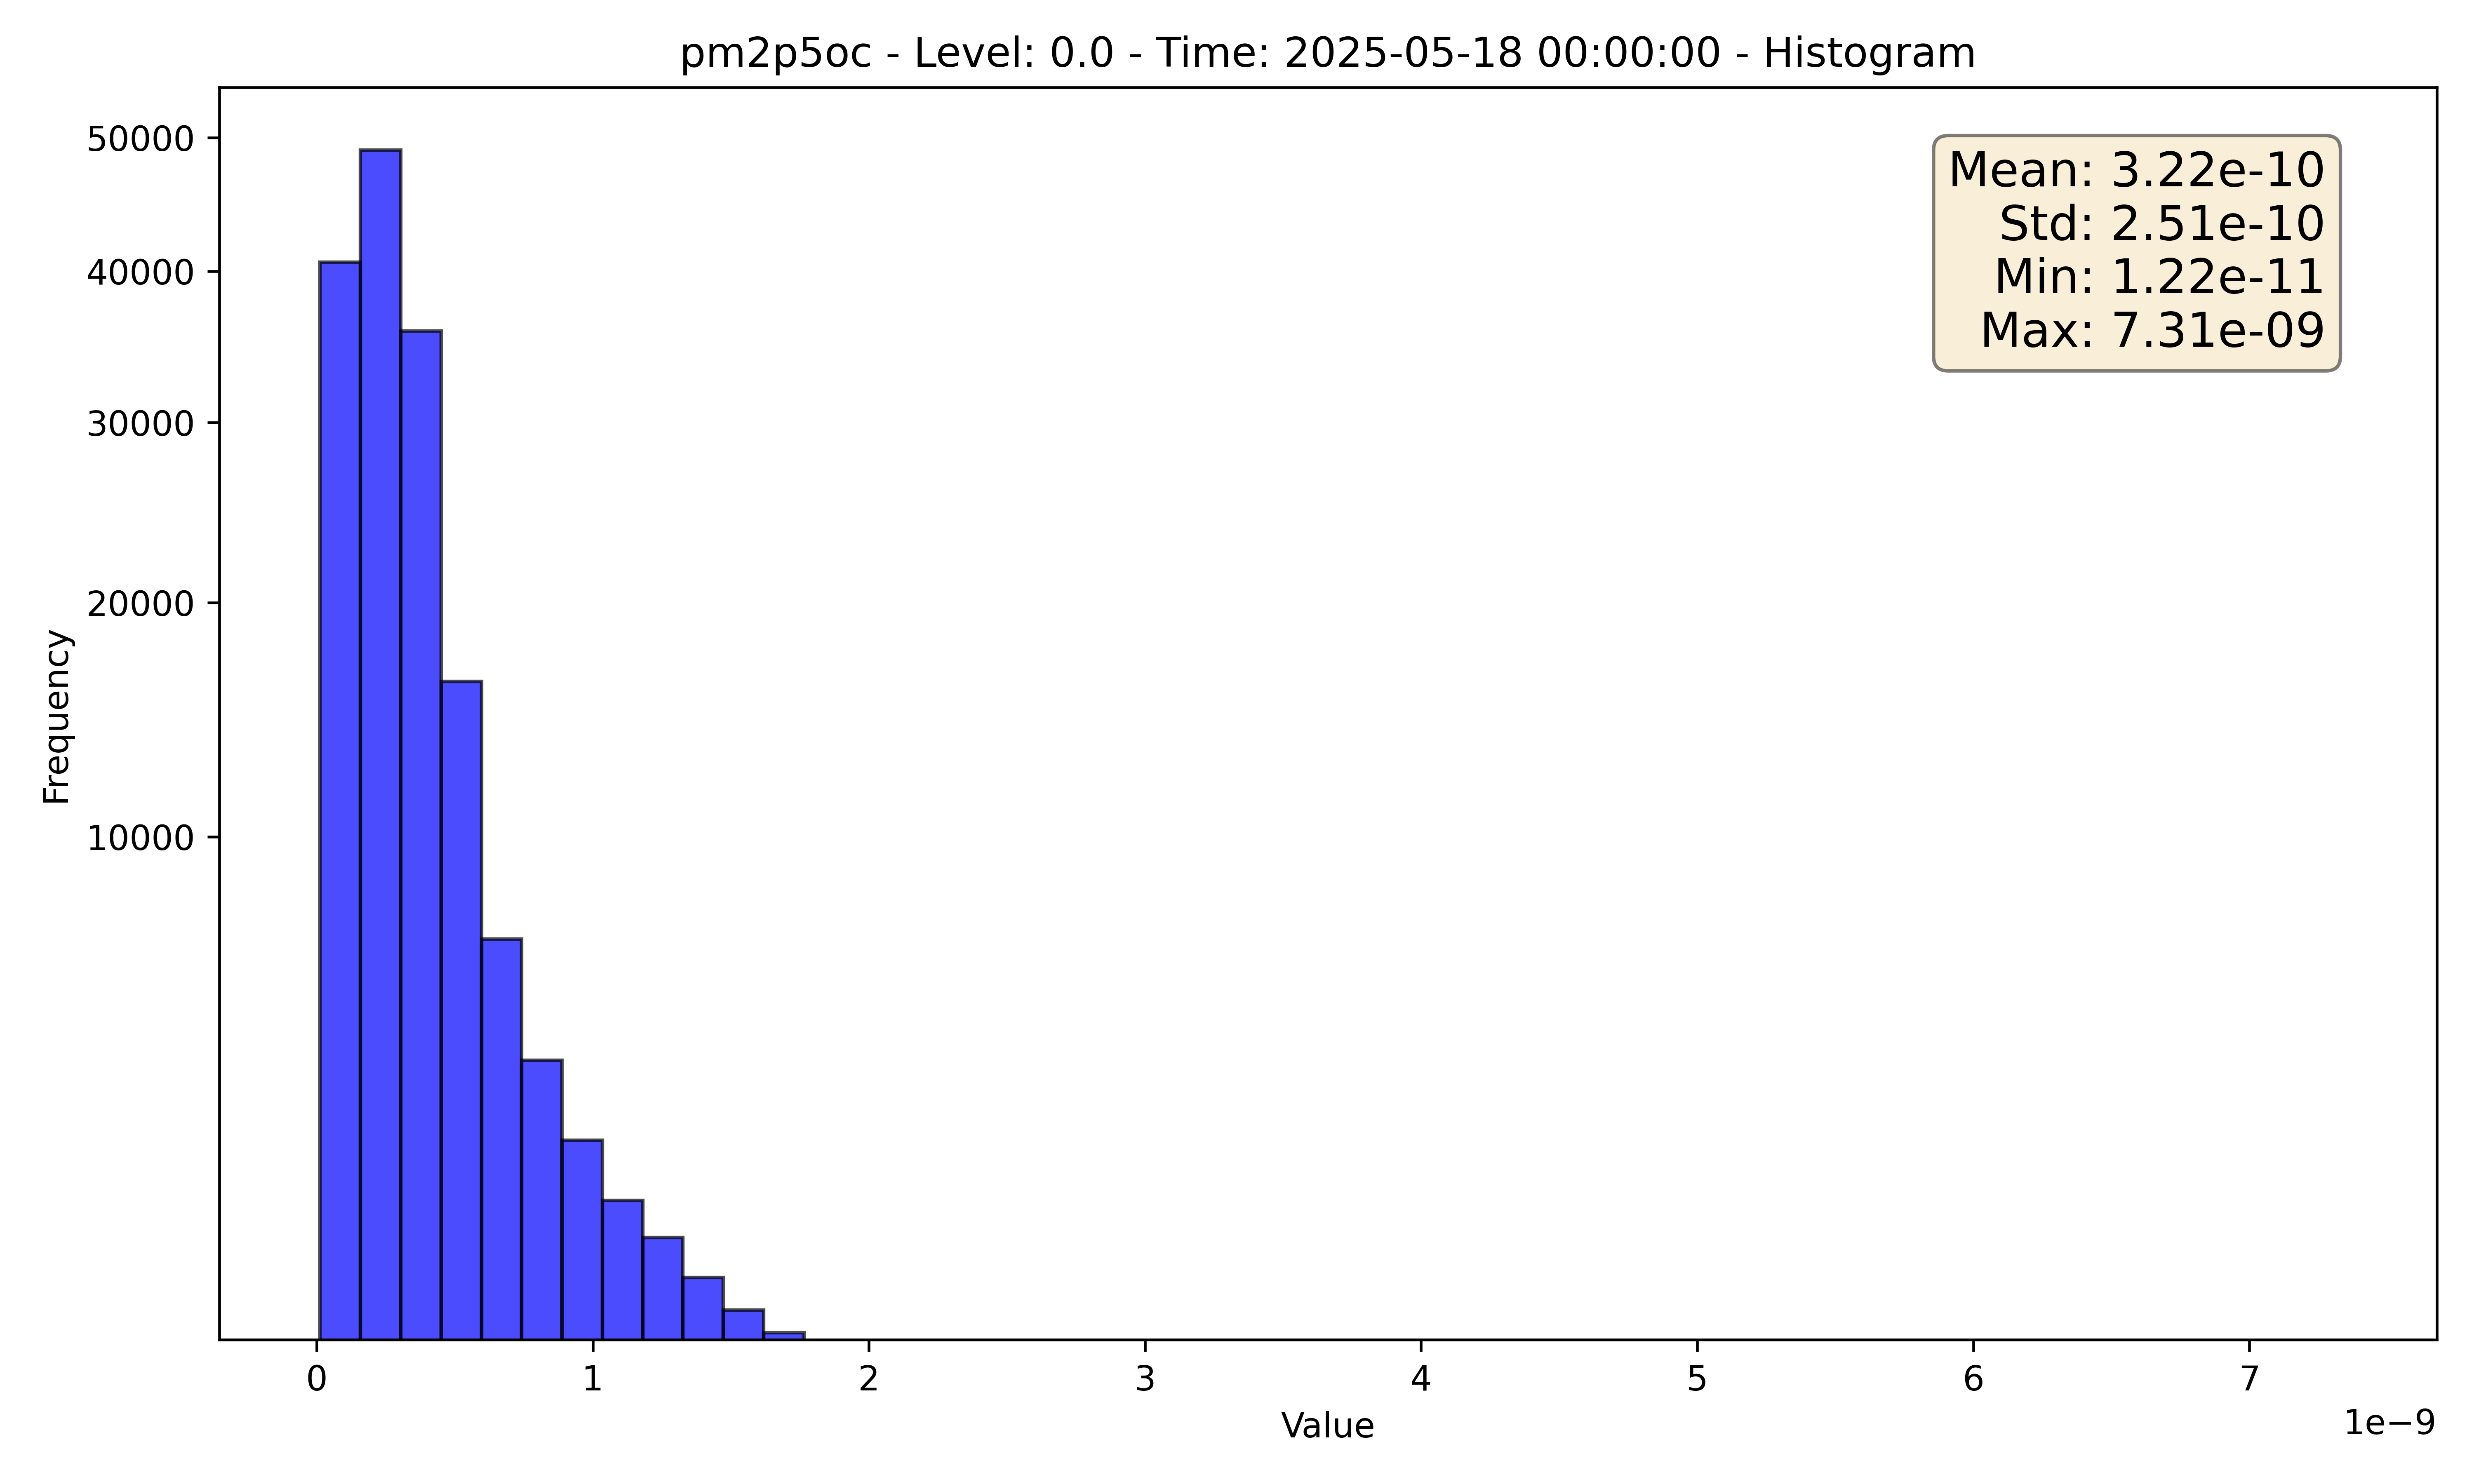
Bar plot showing data frequency for value range.
nes plot -i pm2p5oc_2025051800.nc -v pm2p5oc --method histogram
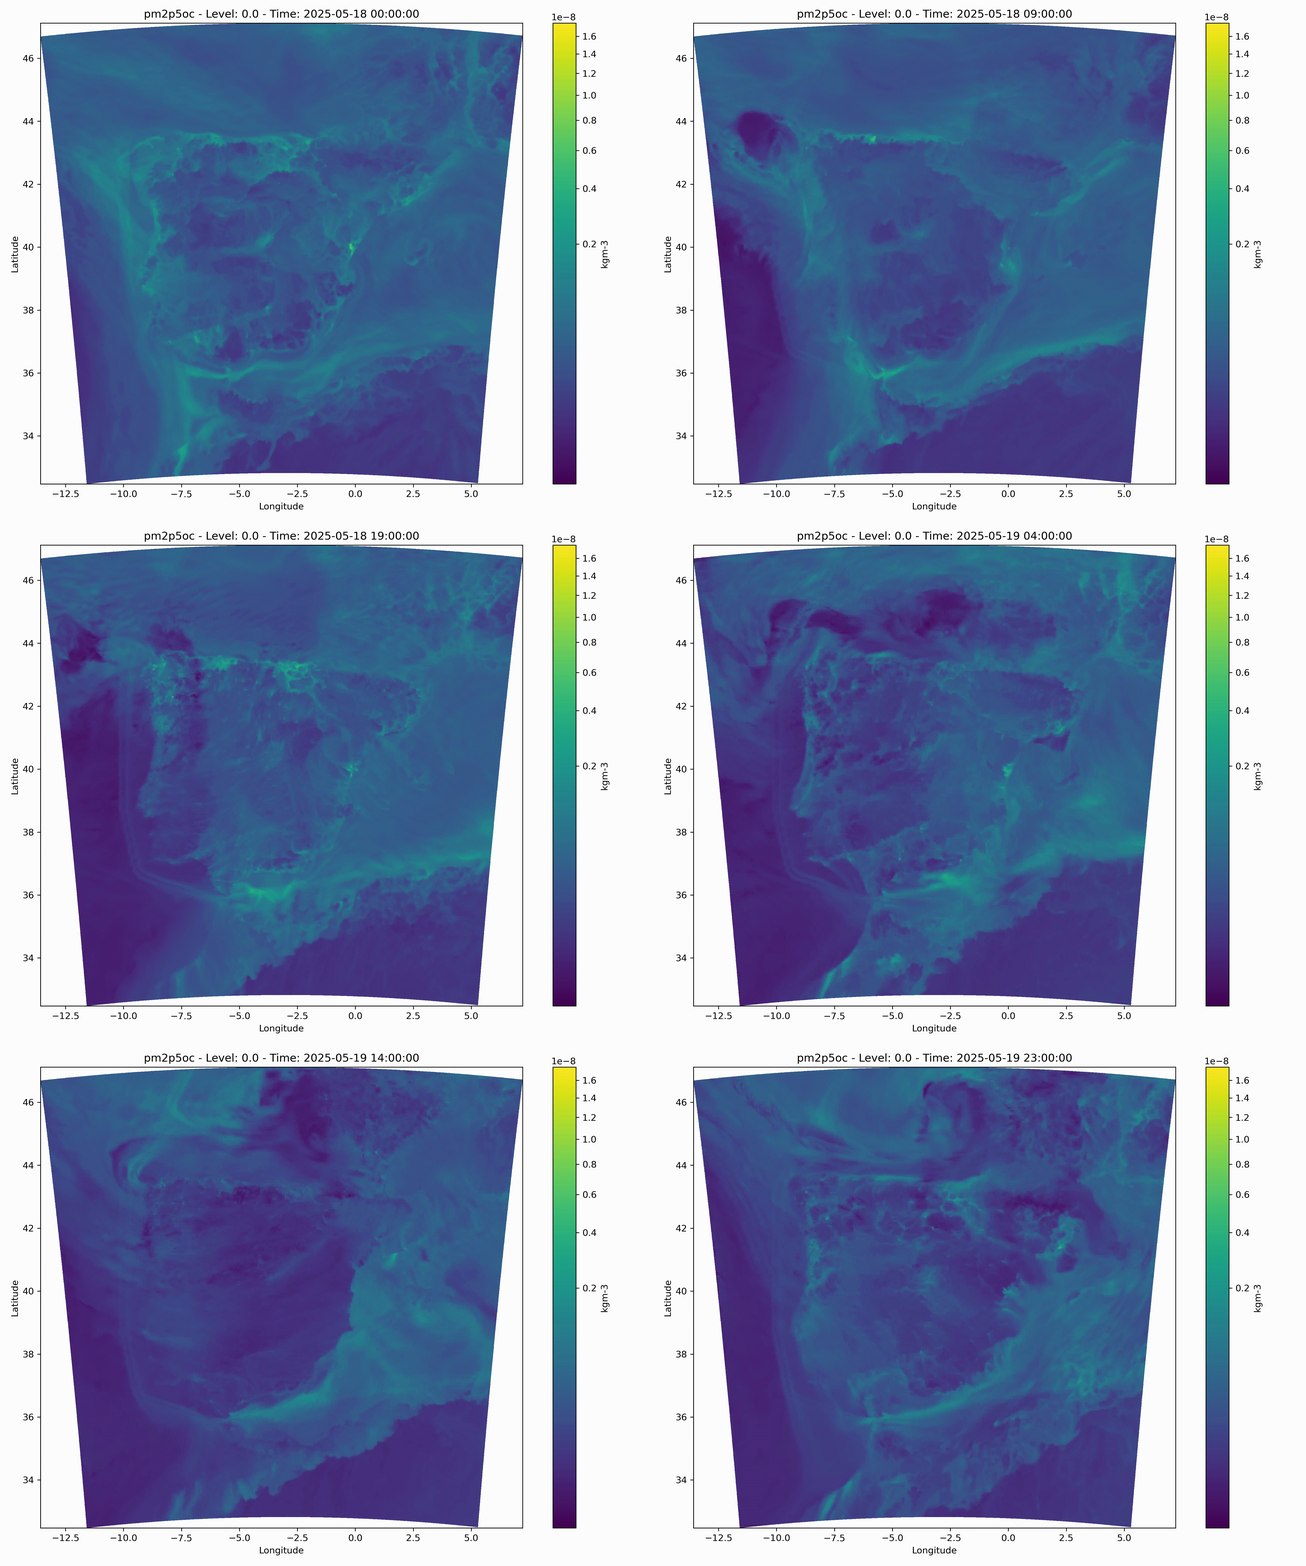
Aggregation of all time steps into an .mp4 file - available for colormesh and contour.
nes plot -i pm2p5oc_2025051800.nc -v pm2p5oc --method animation